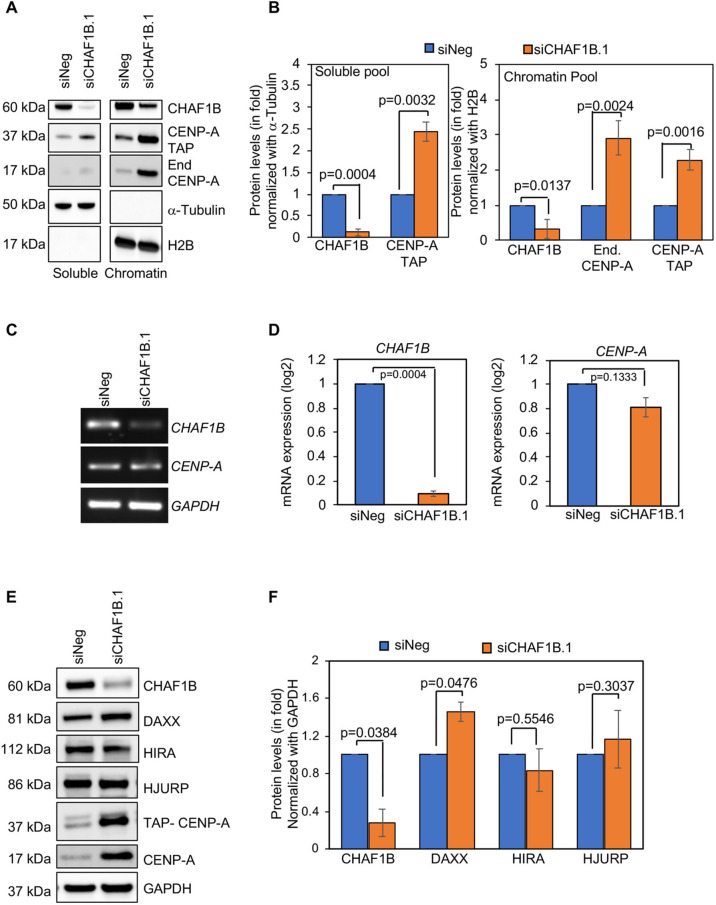
Fig. 6.
CHAF1B-depleted cells show an enrichment of CENP-A in chromatin and increased levels of the histone H3.3 chaperone DAXX. (A) Western blots of cellular fractionated lysates prepared from HeLaYFP–CENP-A-low cells transfected with the indicted siRNAs for 72 h and analyzed using antibodies as indicated. (B) Quantification of CHAF1B, TAP-tagged CENP-A and endogenous (‘End.’) CENP-A in the soluble (left) and chromatin (right) fractions of HeLaCENP-A–TAP cells transfected with the indicated siRNAs. The protein levels were normalized against those of α-tubulin and H2B for the soluble and chromatin fractions, respectively, and expressed as fold increase or decrease relative to those of control cells. (C,D) Gels (C) and bar charts (D) from semi-quantitative RT-PCR and RT-qPCR, respectively showing the mRNA levels of CHAF1B and CENPA in HeLaCENP-A–TAP cells transfected with the indicated siRNAs. GAPDH was used as loading control. In D, the levels were normalized against those of GAPDH and expressed as a log2 fold change. DAXX mRNA levels were also analyzed as part of these experiments (Fig. S5A,B), and the data for CHAF1B and GAPDH are shown again in Fig. S5A,B for comparison with the DAXX results. (E,F) Western blot analysis (E) and quantification (F) of lysates prepared from HeLaCENP-A–TAP cells transfected with the indicated siRNAs for 72 h and analyzed using antibodies as indicated. GAPDH was used as a loading control and used to normalize the levels of other proteins to express as a fold increase or decreased relative to those of control cells. For B,D,F, error bars represent s.e.m. from three independent experiments and P-values were calculated using unpaired, two-tailed t-test.

