Figure 1.
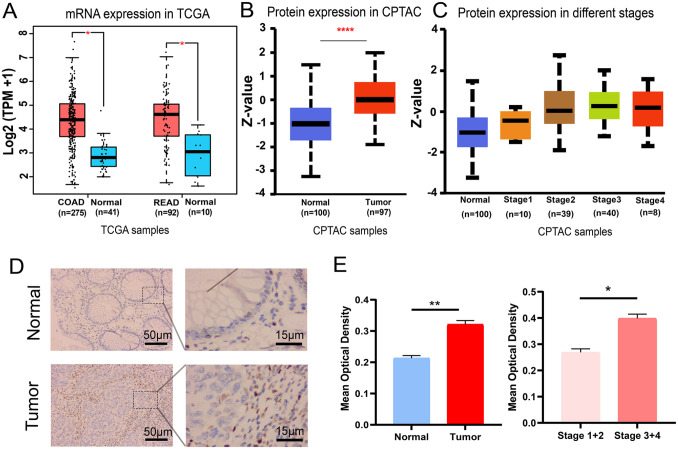
Elevated LOXL2 expression was positively related to the progression of CRC. (A) The mRNA expression in the TCGA-COAD and TCGA-READ cohorts. One-way ANOVA test. *p < 0.05. (B) The protein expression in the CPTAC samples. Z-values represented the standard deviations from the median across samples. Student’s t-test. ****p < 0.0001. (C) The protein expression level of LOXL2 was found gradually increased with the progress of stages in CPTAC samples. (D) Representative immunohistochemical staining images in the normal and tumor tissues. Length scale bars are 50 µm at 100× magnification and 15 µm at 400× magnification. (E) The MOD values of LOXL2 in different subgroups (Normal, Tumor, Stages I and II, and Stages III and IV). Student’s t-test. **p < 0.01, *p < 0.05. Error bars, SD.

