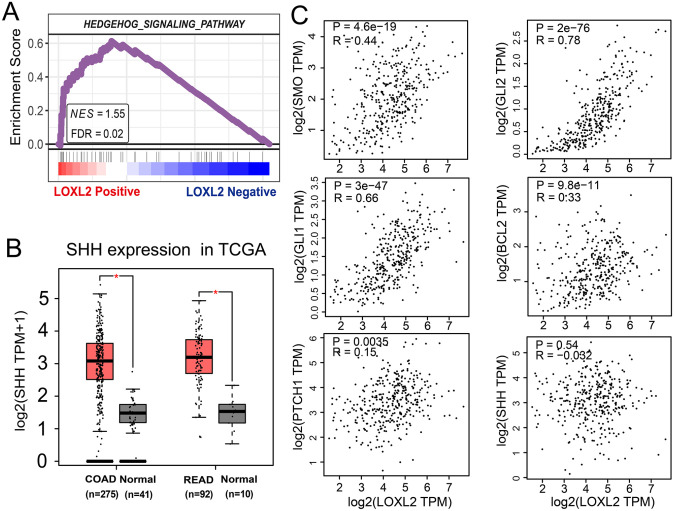
Figure 6.
Correlations between LOXL2 expression and Hedgehog signaling pathway. (A) The GSEA result in the TCGA-COAD and TCGA-READ samples with Pearson method. The Hedgehog signaling pathway was significantly enriched in the LOXL2-positive side. (B) The mRNA expression of SHH was significantly up-regulated in the TCGA-COAD and TCGA-READ samples compared with normal samples. (C) Spearman correlation analyses between the expression of LOXL2 with SMO (R = 0.44, p < 0.001), GLI1 (R = 0.66, p < 0.001), GLI2 (R = 0.78, p < 0.001), PTCH1 (R = 0.15, p < 0.01), BCL2 (R = 0.33, p < 0.001) and SHH (R = −0.032, p = 0.54). One-way ANOVA.
*p < 0.05.

