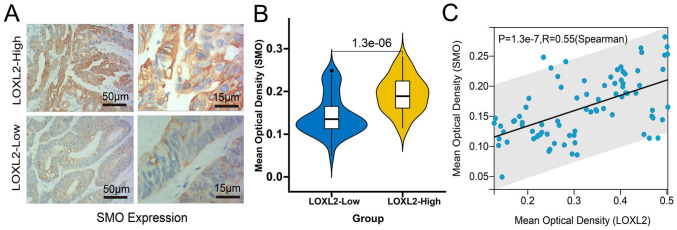
Figure 7.
Validation of the correlation between the LOXL2 and SMO expression with immunohistochemistry. (A) Representative immunohistochemical staining images of SMO in the LOXL2-High and LOXL2-Low expressed tissues. Length scale bars are 50 µm at 100× magnification and 15 µm at 400× magnification. (B) The differential MOD values of SMO in the LOXL2-High and LOXL2-Low expressed groups compared with the Wilcoxon test. (C) The Spearman correlation between the MOD values of SMO and LOXL2 in the clinical samples (R = 0.55, p < 0.001).

