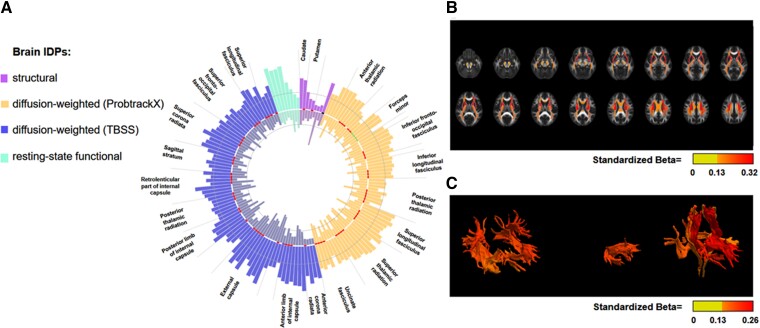
Figure 3.
Observational association of brain IDPs with SBP and cognitive function. The circular bar blot presents absolute standardised estimates of the association of 155 imaging-derived phenotypes (IDPs) with SBP (outer bars) and cognitive function (inner bars). Presented IDPs demonstrated significant genetic and observational association with SBP and significant observational association with cognitive function (nominal P < 0.05; 150 IDPs with FDR-adjusted P < 0.05) in the opposite direction compared with the association with SBP. Shaded circles demonstrate a standardised observational estimate of 0.05 (SBP) or 0.025 (cognitive function). Tracts and structures from either hemisphere and appearing more than three times (diffusion-weighted IDPs) or one time (structural IDPs) among 155 IDPs are depicted. (B) Heatmap shows the association’s strength between the cerebral regions identified by diffusion-weighted magnetic resonance imaging with TBSS analyses and the link with SBP. (C) Heatmap shows the association’s strength between the cerebral regions identified by diffusion-weighted magnetic resonance imaging with PROBTRACK analyses and the connection with SBP.

