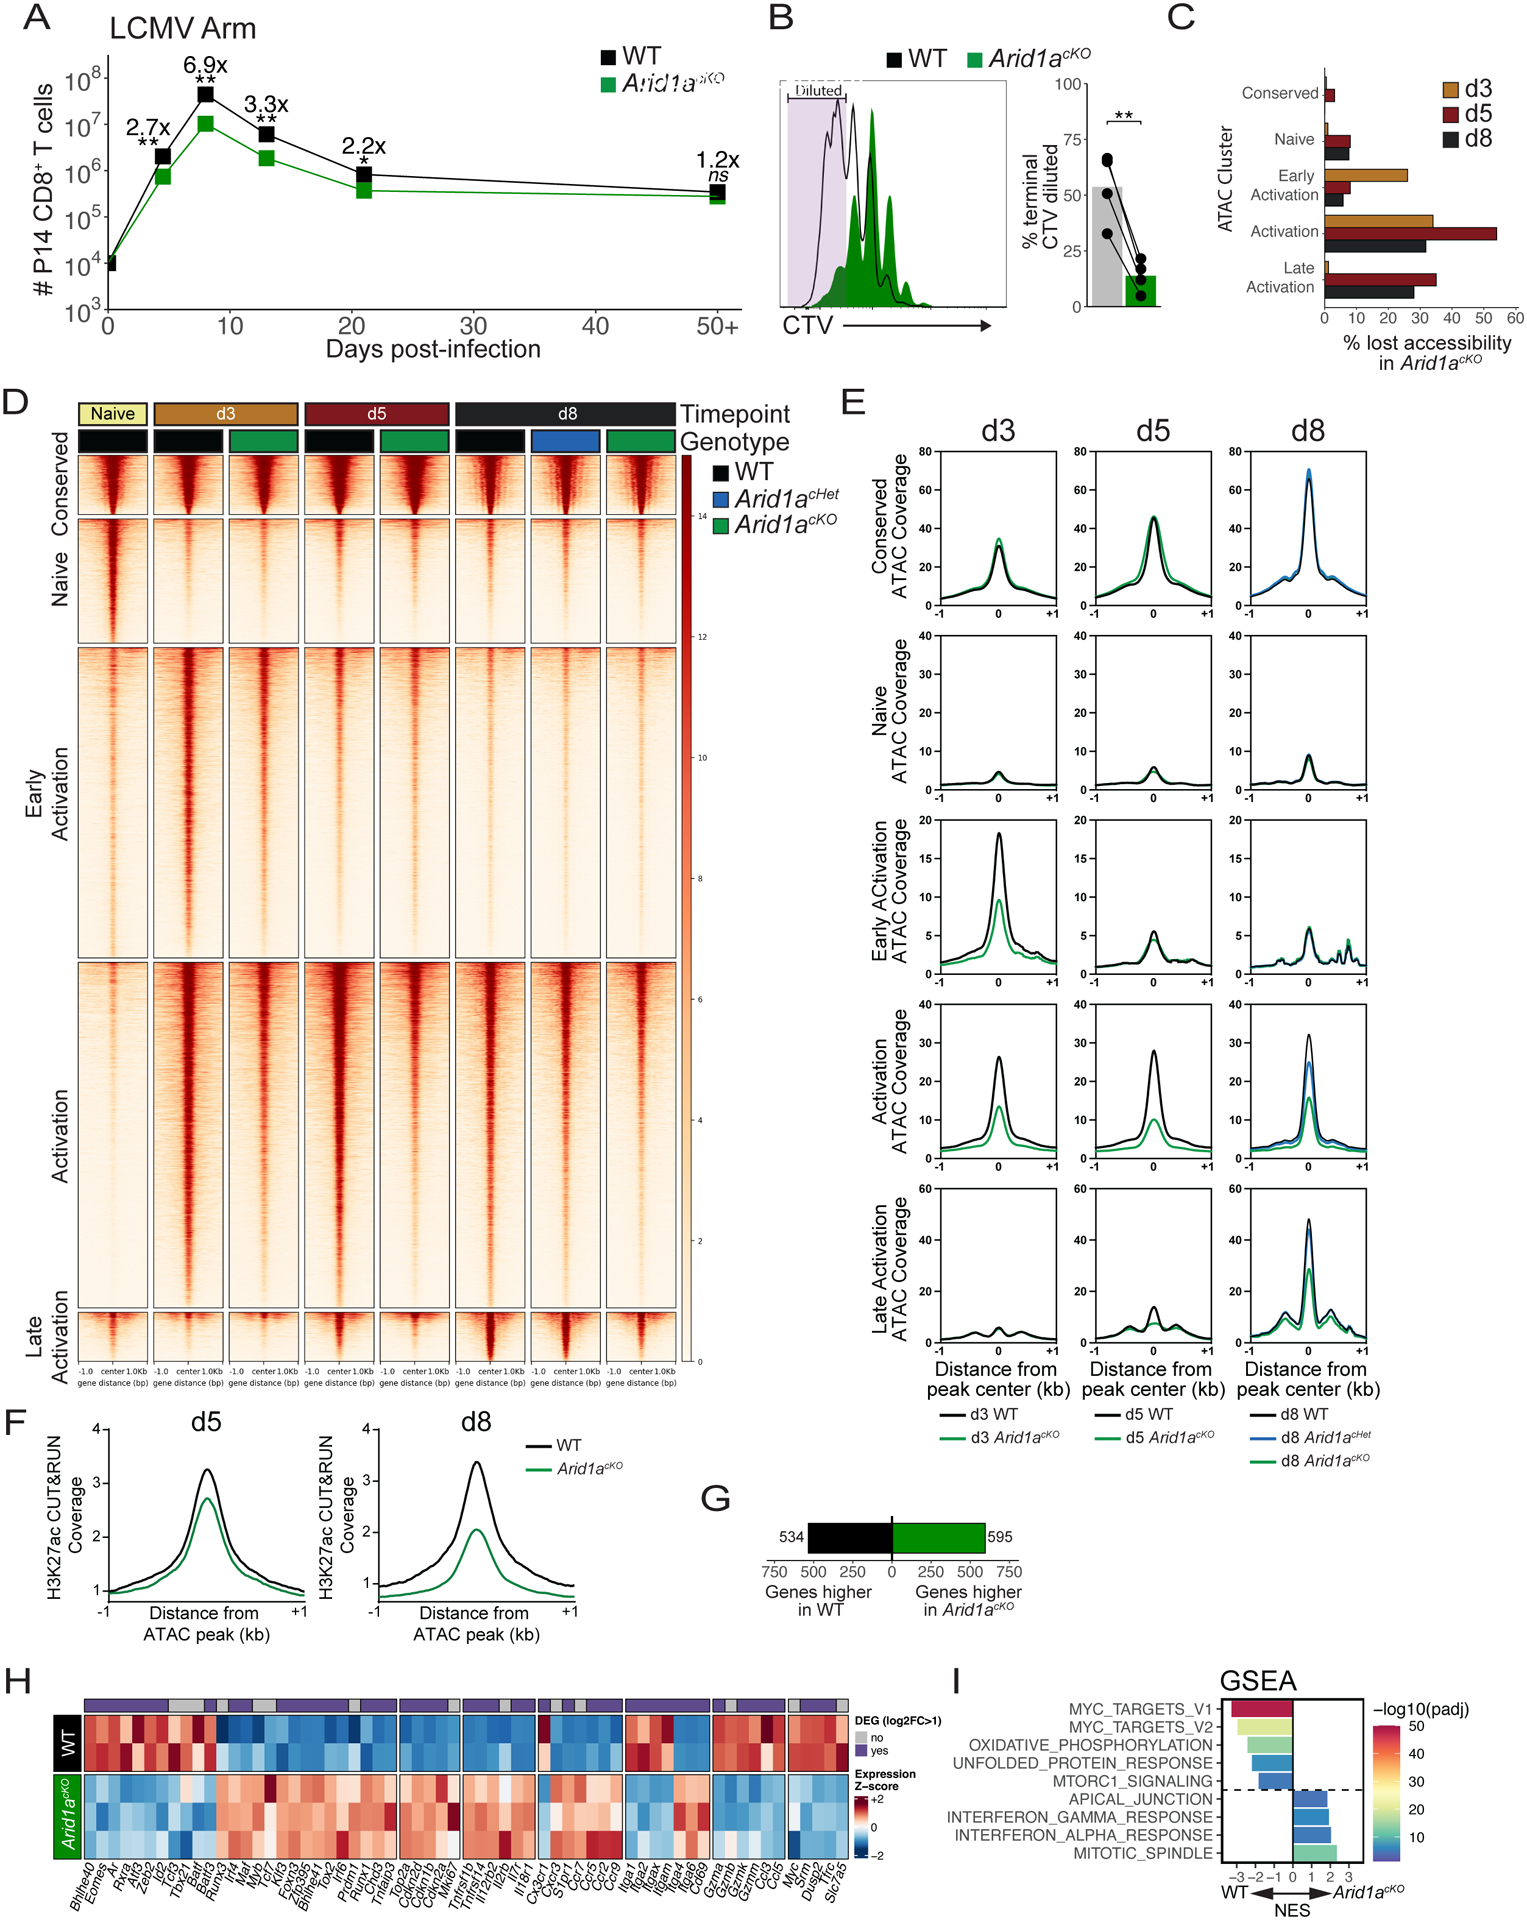
Fig 2. Arid1a promotes clonal expansion and opening of activation-induced enhancers.

(A) Numbers of WT (black) and Arid1acKO (green) P14 cells after infection with LCMV-Armstrong. n=8 (d4.5), 8–11 (d8), 4 (d13), 4 (d21), 8 (d50+). (B) CellTrace Violet dilution of WT and Arid1acKO P14 cells at 84h p.i. Frequency of cells that divided 7+ times are quantified in the bar graph. (C) Percentage of ATAC-seq peaks lost (2-fold change, FDR<0.05, Benjamini-Hochberg) in Arid1acKO relative to WT cells at d3, d5, and d8 p.i. (D, E) ATAC-seq signal coverage of WT and Arid1acKO P14 cells at d3, d5, and d8 p.i. using the same cluster designations defined in Figure 1A. (F) H3K27ac CUT&RUN signal coverage centered on ATAC-seq peaks in WT vs. Arid1acKO cells. (G-I) WT and Arid1acKO effector cells were isolated at d3 p.i. and compared for differentially expressed genes (DEGs) by RNA-sequencing (>2-fold change, adjusted p-value<0.05, Benjamini-Hochberg). Number of DEGs (G), heatmap of biologically relevant DEGs (H), and gene set enrichment analysis (GSEA) (I) between WT and Arid1acKO effector cells are shown. All heatmap genes shown have an adjusted p-value < 0.05. (I) Top 8 Hallmark gene sets (adjusted p value < 0.01, 10,000 permutations) are shown. ns, not significant; *p<0.05, **p<0.005.
