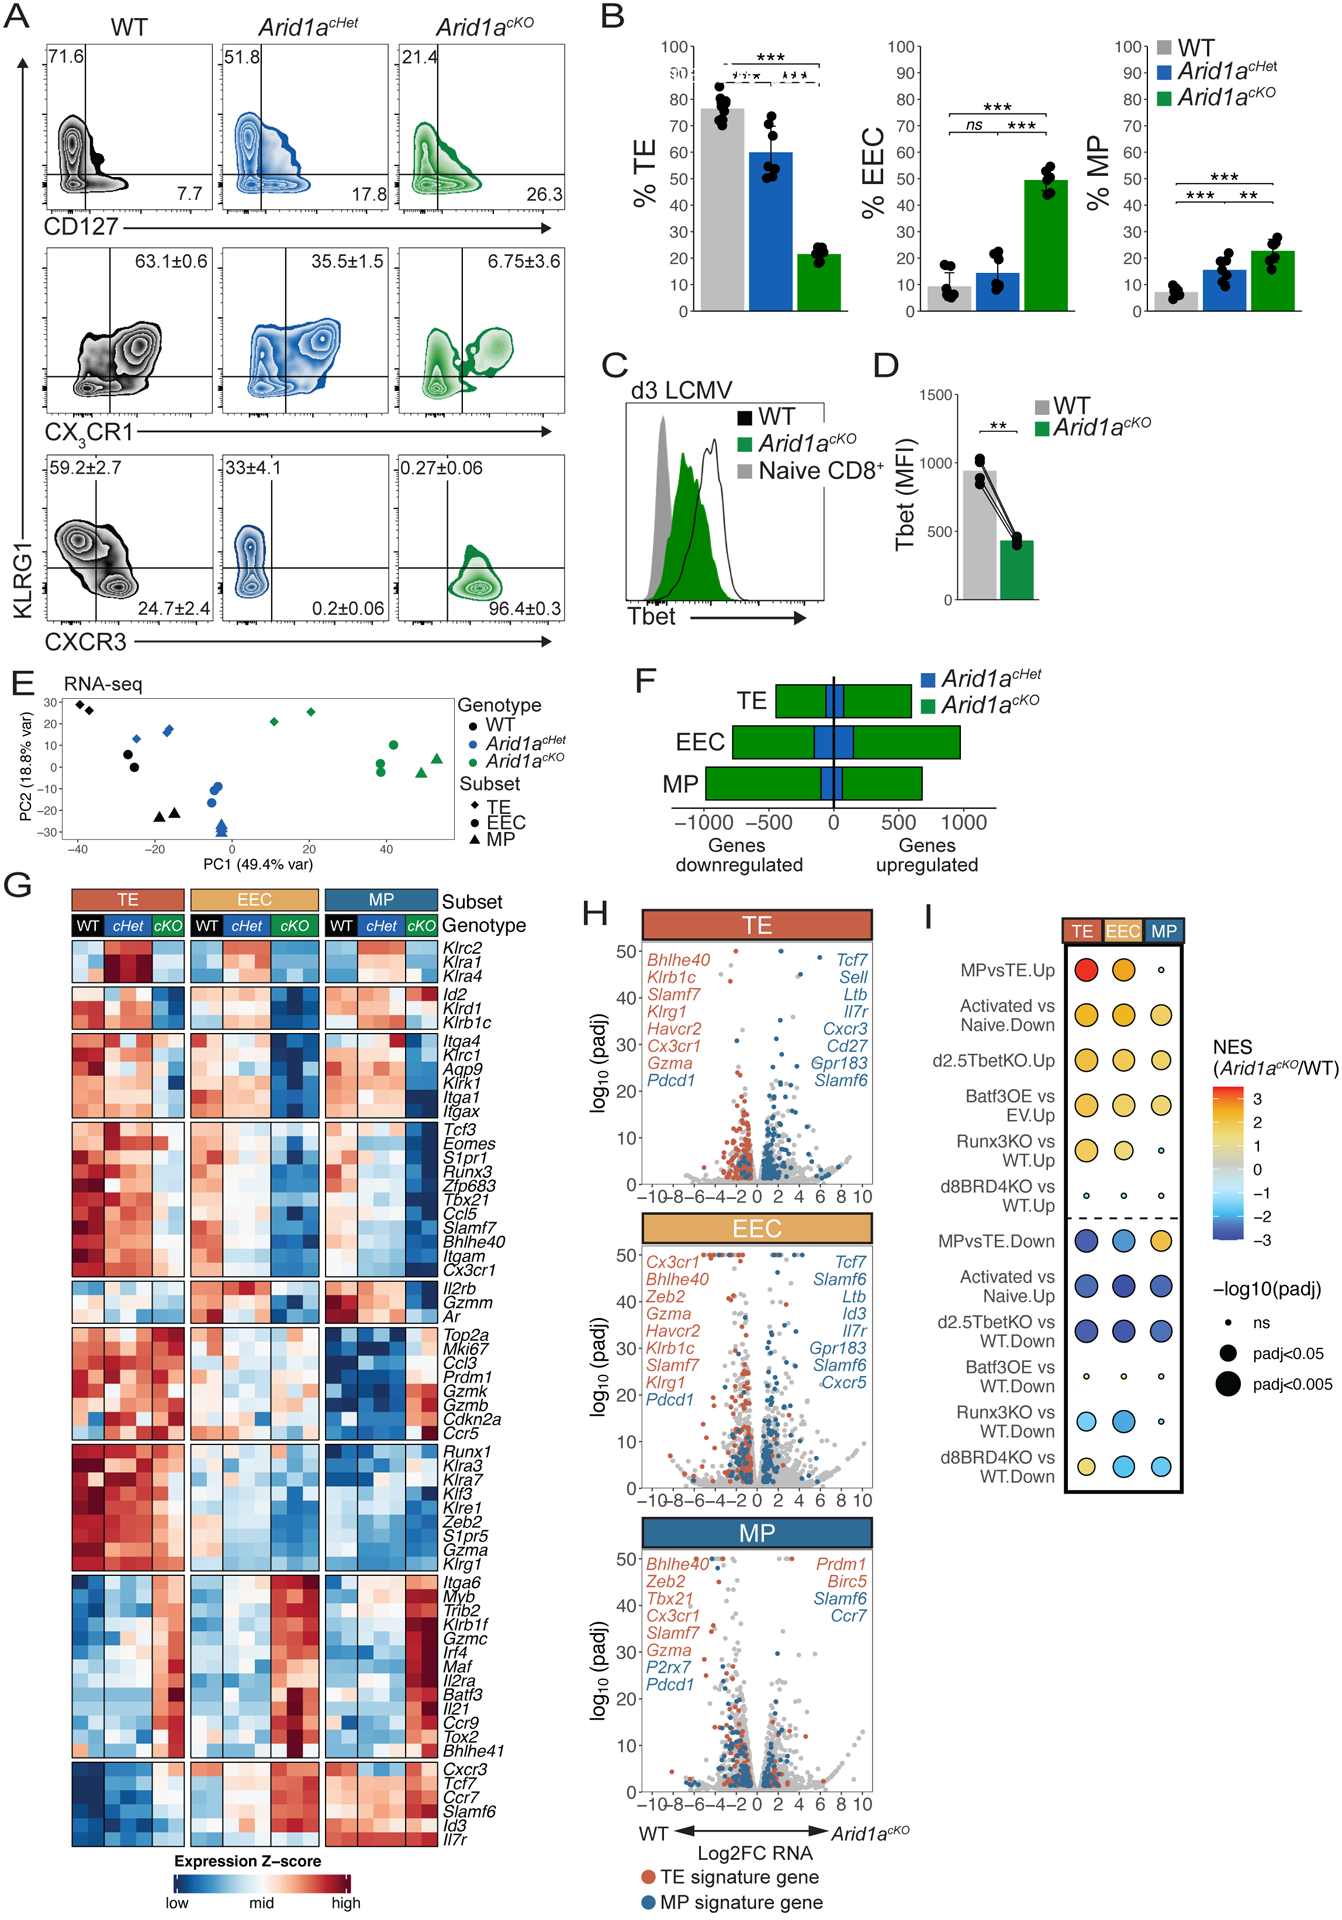
Fig 3. Arid1a acts in a dose-dependent manner to specify effector subset gene expression patterns.

(A,B) Surface marker expression of WT (black, n=11), Arid1acHet (blue, n=7), and Arid1acKO (green, n=7) P14 cells at d8–9 p.i. was analyzed by flow cytometry (A) and mean ± SEM frequencies of TE (KLRG1+CD127−), MP (KLRG1−CD127+), KLRG1+CX3CR1+, KLRG1+CXCR3−, and KLRG1−CXCR3+ cells are shown in bar graphs (B). (C,D) T-bet expression in WT and Arid1acKO P14 cells at d3 p.i. (D) Paired t-test. (E-I) WT, Arid1acKO and Arid1acHet effector cells were isolated at d8 p.i. and sorted based on expression of TE, EEC and MP markers as defined in (A) and differentially expressed genes (DEGs) were identified by RNA-seq. Principal component analysis plot of all the samples (E), number of DEGs (F), heatmap of select DEGs (G), volcano plots of all DEGs including highlighted TE-signature genes (red) and MP-signature genes (blue) (H), and GSEA (I) were used to assess the DEGs in each subset affected by loss of one or two copies of Arid1a. GSEA analysis in (I) directly compared DEGs between WT and Arid1acKO cells and previously published datasets: Activated vs Naive: GSE10739; d2.5TbetKO: PRJNA547650; Batf3OE vs EV: GSE143504; Runx3KO: GSE81888; d8BRD4KO: GSE173515). ns, not significant; *p<0.05, **p<0.005, ***p<0.0005.
