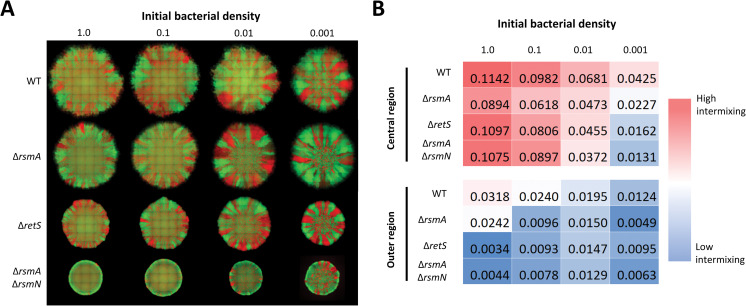
Fig 2. Colony morphology is determined by strain background and bacterial density in inoculum.
(A) Set of representative fluorescence composite images of mixed bacterial colonies of WT, ΔrsmA, ΔretS, and ΔrsmAΔrsmN strains with altered inoculum densities. Isogenic bacterial strains tagged with mCherry (red) and sfGFP (green) fluorophores were mixed at 1 to 1 ratio and after adjusting inoculum density (OD600 1.0; 0.1; 0.01; 0.001) spotted on LB agar, images of whole macrocolonies taken after 48h incubation at 37°C show 2 morphologically distinct regions—highly mixed inner region corresponding to inoculum zone and outer region where spatial segregation of the sub-populations is apparent. A representative image of 3 biological replicates is shown, corresponding individual fluorescence channel images are shown in S4 Fig. (B) Mean sub-population intermixing changes in colony central and outer regions for the corresponding colonies. Spatially resolved mean channel fluorescence and strain intermixing analysis is shown in S5 Fig.

