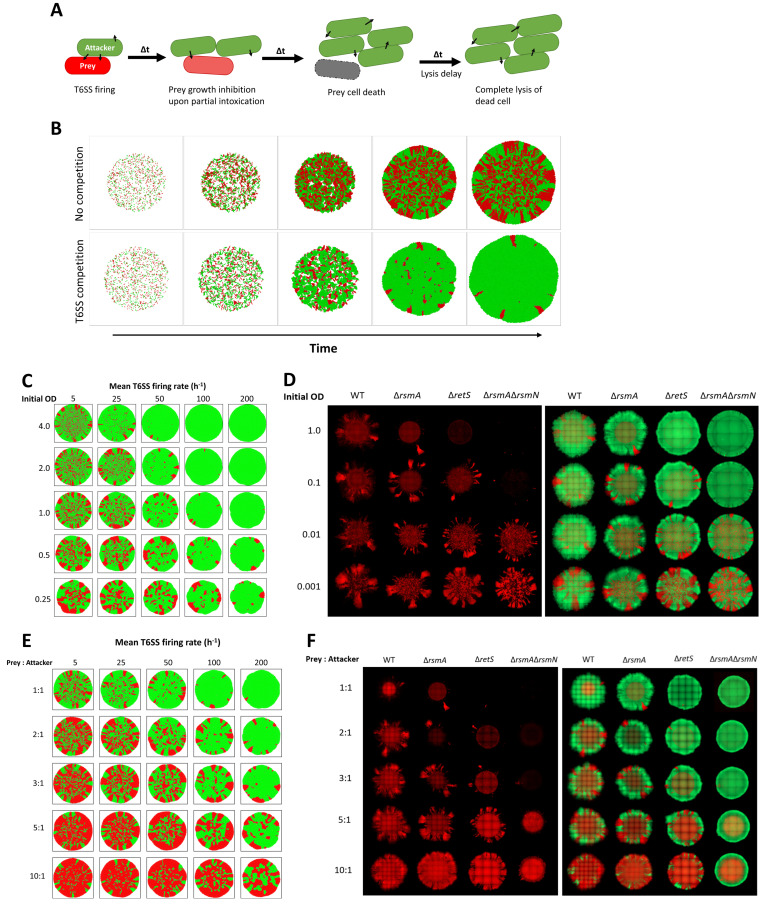
Fig 5. Prey establishment and decrease in inter-population contacts protects T6SS sensitive lineages.
(A) Schematic depicting types of bacteria represented within the model and their fate upon T6SS-based interactions. T6SS+ attacker in green can fire a specified number of T6SSs in random directions and grows over time. Prey bacteria in red are susceptible to T6SS attacks, when prey is hit by T6SS its growth rate is reduced. Once certain threshold of T6SS attacks is reached prey cell dies (grey) and no further growth occurs. Dead prey cells remain in simulation until lysis defined by a certain delay is reached and are subsequently removed. (B) Simulation of 2 mixed colony development over time with and without T6SS mediated competition. Initially 1 to 1 mix of bacteria from both populations are randomly scattered on surface in circular inoculum zone. Bacterial growth occurs through elongation and division and in absence of active movement bacteria expand through rigid body interactions. At a whole colony scale, inoculum zone is filled by intermixed clonal clusters and further expansion is restricted by neighbouring cells exerting forces upon each other. Over simulation time-course radial expansion results in formation of distinct sectors in the region outside the inoculum area. In a mix with T6SS interactions, sensitive prey in red can be seen to initially establish in the colony centre, but over simulation time-course be gradually eliminated by T6SS+ attacker in green. Specific parameter space of simulations is shown in S4 Table. Representative simulation outputs showing how decrease in initial bacterial density (C) or changes in strain mixing ratio (E) within initial population promotes prey (red) survival in a mix attacker population (green) with differing mean of T6SS firing rate and within a context of highly lytic toxins. (Toxin lethal dose = 5, lysis delay = 3min). Tse5 mediated competition outcomes in context of strains with differing T6SS activity levels using populations inoculated from different initial density (D) or changing the prey to attacker ratio within inoculum (F). Representative image of 48h old mixed colonies of Tse5 sensitised bacteria in red in competition with T6SS+ strains of the same regulatory background in green. Mixed bacterial colonies of WT, ΔrsmA, ΔretS, and ΔrsmAΔrsmN strains in different columns. First set of images shows prey distribution only and second set shows corresponding fluorescent channel overlay of both prey and attacker populations. Strains contain constitutively expressed fluorescent proteins, prey labelled with mCherry (shown in red) and attacker with sfGFP (shown in green). Isogenic bacterial strains tagged with mCherry (red) and sfGFP (green) fluorophores were mixed at 1 to 1 ratio and after adjusting inoculum density (OD600 1.0; 0.1; 0.01; 0.001) spotted on LB agar to test impact of inoculum density (D). In (F) each of the rows contains a set of representative images of colonies set up with a different prey to attacker ratio in the inoculum (1:1, 2:1, 3:1, 5:1, 10:1) and the overall bacterial density of OD600 = 1.0. Images of whole microcolonies taken after 48h incubation at 37°C on LB with (2% w/v) agar, a representative image of 3 biological repeats is shown.

