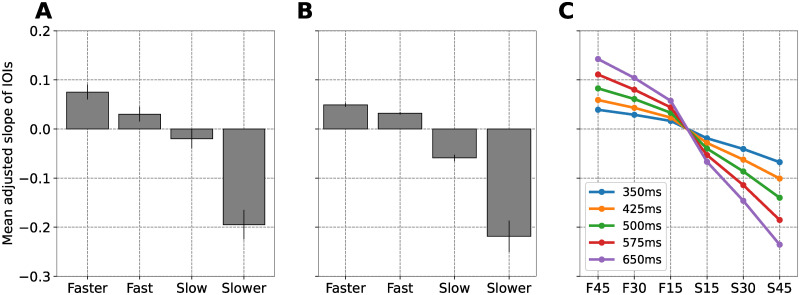
Fig 3. Simulation of the slope between consecutive IBIs when an unpaced musician performs a melody starting at a tempo that is different than the SMT.
(A) The mean adjusted slope of consecutive IBIs (and standard error; N = 24) when solo musicians perform a simple melody starting a tempo that is fast, faster, slow, or slower compared to their SMT. (B) Our simulations showing the mean adjusted slope of consecutive IBIs (and standard error; N = 23) when ASHLE oscillates, without a stimulus, starting at a frequency that is fast, faster, slow, or slower compared to its f0. (C) Adjusted slope predictions when different ASHLE models with different f0 oscillate without stimulation, starting with a period that is 45% shorter (F45), 30% shorter (F30), 15% shorter (F15), 15% longer (S15), 30% longer (S30), or 45% longer (S45) compared its to the period of its f0. For consistency with predictions made in experiment 1, here we also use the F and S on the x-axis.

