
Figure 4.
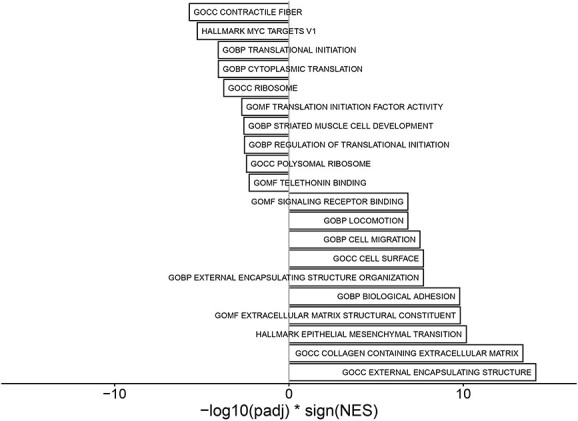
GSEA. Barplot of the 10 most significantly up- and downregulated gene sets in rhuEPO-treated versus untreated FRDA samples.
Official websites use .gov
A
.gov website belongs to an official
government organization in the United States.
Secure .gov websites use HTTPS
A lock (
) or https:// means you've safely
connected to the .gov website. Share sensitive
information only on official, secure websites.
GSEA. Barplot of the 10 most significantly up- and downregulated gene sets in rhuEPO-treated versus untreated FRDA samples.