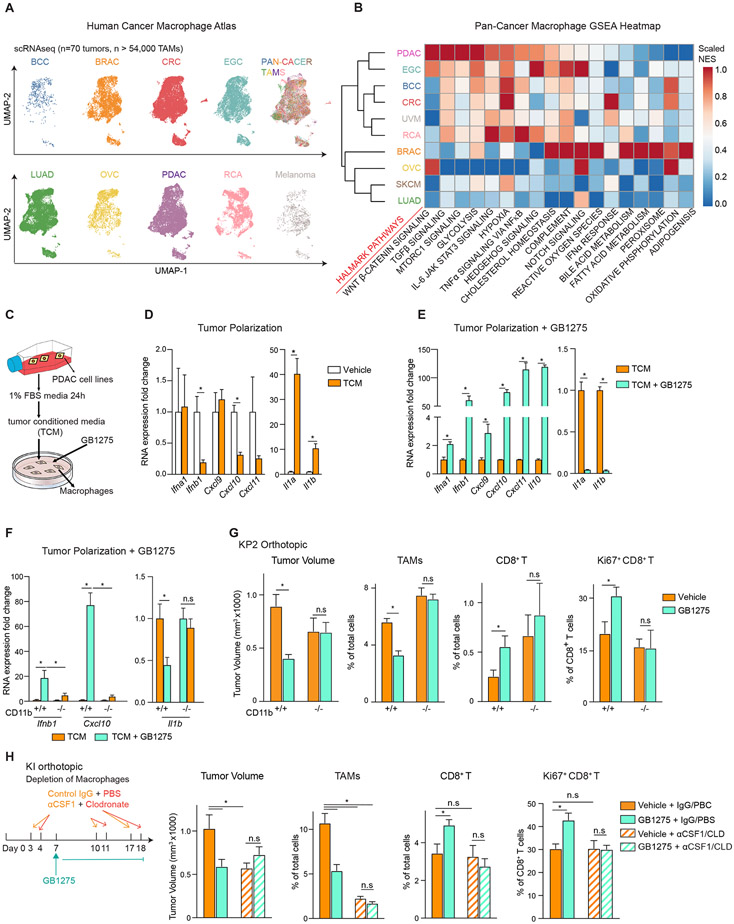
Figure 1. GB1275 anti-tumor activity is dependent on TAM reprograming.
(A) UMAP visualization of 54,000 TAMs from different cancer types, including PDAC, early gastric cancer (EGC), basal cell carcinoma (BCC), colorectal cancer (CRC), uveal melanoma (UVM), renal cancer (RCA), breast cancer (BRAC), ovarian serous cystadenocarcinoma (OVC), skin cutaneous melanoma (SKCM), and lung adenocarcinoma (LUAD). Clusters are annotated for cancer types.
(B) GSEA identified pathway enrichment in TAMs from each cancer type.
(C) Schematic of in vitro macrophage system.
(D) QPCR mRNA expression analysis of BMDMs treated with TCM for 6 hours. Changes in gene expression are depicted as the fold change from the vehicle.
(E-F) QPCR mRNA expression analysis of BMDMs isolated from wild-type(E) or CD11b-null mice
(F) treated with TCM ± GB1275 for 7 hours. Changes in gene expressions are depicted as the fold change from the vehicle.
(G) WT or CD11b-null mice bearing syngeneic orthotopic KP2 tumors were treated with vehicle or GB1275 for 14 days. Tumor volume and frequencies of tumor-infiltrating TAMs, CD8+ T cells, and Ki67+ CD8+ T cells are depicted (n = 6–8/group).
(H) Mice bearing orthotopic KI tumors treated with lgG+ PBS or αCSF-1 IgG+ Clodronate as depicted. Tumor volume and frequencies of PDAC-infiltrating TAMs, CD8+ T cells, and Ki67+ CD8+ T cells at day 19 are depicted (n = 7–9/group). All graphs depict the mean ± SEM and *denotes a value of p < 0.05 using the two-sided t-test. In vitro data are representative of three independent experiments.
Also see Figure S1.

