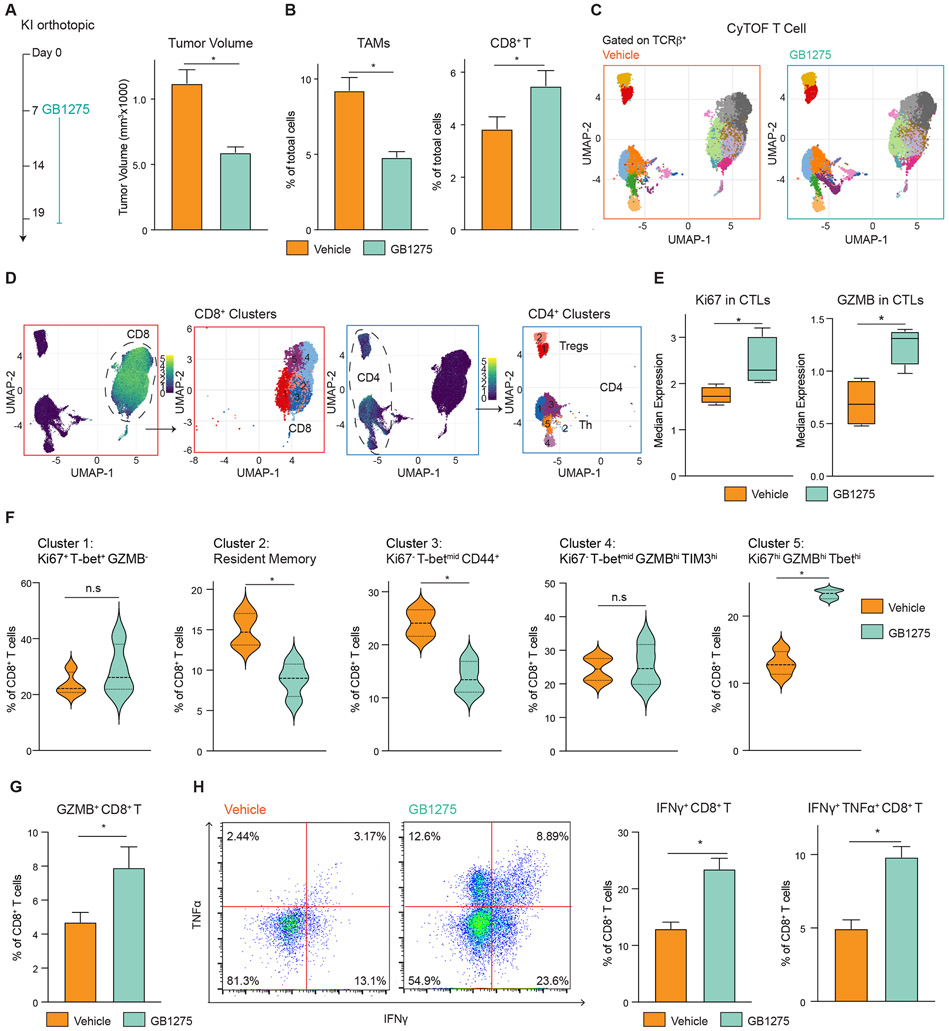
Figure 2. TAMs CD11b activation results in more proliferative effector T cells.
(A) Syngeneic KI orthotopic model and treatment (left). Tumor burden in each group (right) (n = 8/group).
(B) Frequencies of TAMs and CD8+ T cells from A (n = 7/group).
(C) CyTOF UMAP plot of tumor-infiltrating T cells.
(D) Subpopulations of CD8+ T cells and CD4+ T cells.
(E) Median expressions of Ki67 and GZMB in CD8+ T cells.
(F) Percentage of individual subclusters in CD8+ T cells.
(G) Syngeneic KP2-OVA orthotopic model treated with vehicle or GB1275 for 12 days, and frequencies of GZMB+ CD8+ T cells (n = 7/group).
(H) Gate of functional assay of CD8+ T cells from G (left). Percentage of functional CD8+ T cells (right) (n = 7/group). Graphs depict the mean ± SEM and *denotes a value of p < 0.05 using a two-sided t-test for comparisons between two groups.
Also see Figure S2.

