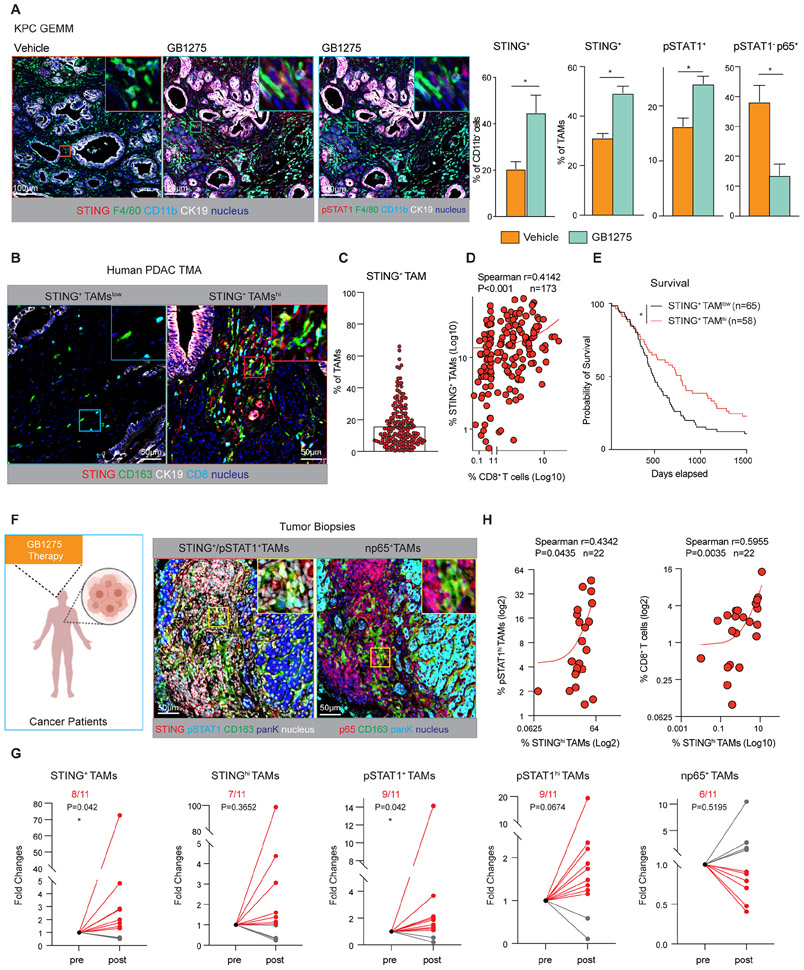
Figure 5. STING activation by GB1275 in mouse models and tumor biopsies.
(A) Representative mpIHC staining for pSTAT1, STING, F4/80, CD11b, and CK19 in tumors from 14-day vehicle and GB1275 treated KPC mice. Scale bar, 100μm. Right, percentages of STING+ CD11b+ cells, STING+ TAMs, pSTAT1+ TAMs, and pSTAT1− p65+ TAMs (n = 7–9 mice per group).
(B) Representative mpIHC staining for STING, CD163, CK19, and CD8α in human PDAC TMAs. Scale bar, 50μm.
(C) Average percentage of STING+ TAMs from the TMAs.
(D) Scatter plot showing Spearman’s correlation between the percentage of STING+ macrophages and CD8+ T cells from B.
(E) Kaplan–Meier survival curves for patients with high STING+ TAM infiltration and low STING+ TAM infiltration from B.
(F) Representative mpIHC staining for STING, pSTAT1, p65, CD163, and pan-keratin (PanK) in 11 paired tumor biopsies from patients. Scale bar, 50μm.
(G) Relative fold changes of STING+, STINGhi macrophages, pSTAT1+, pSTAT1hi macrophages, and nuclear p65+ macrophages in paired pre- and post-groups.
(H) Scatter plots showing Spearman’s correlations between the percentage of STINGhi macrophages and pSTAT1hi macrophages in all 22 tumor biopsies. Scatter plots showing Spearman’s correlation between the percentages of STINGhi macrophages (out of total cells) and CD8+ T cells in all 22 tumor biopsies (right). Graphs show the mean ± SEM; *denotes p < 0.05 using the two-sided t-test between two groups, one sample t-tests, and Wilcoxon tests, or the log-rank test for Kaplan–Meier survival curves.

