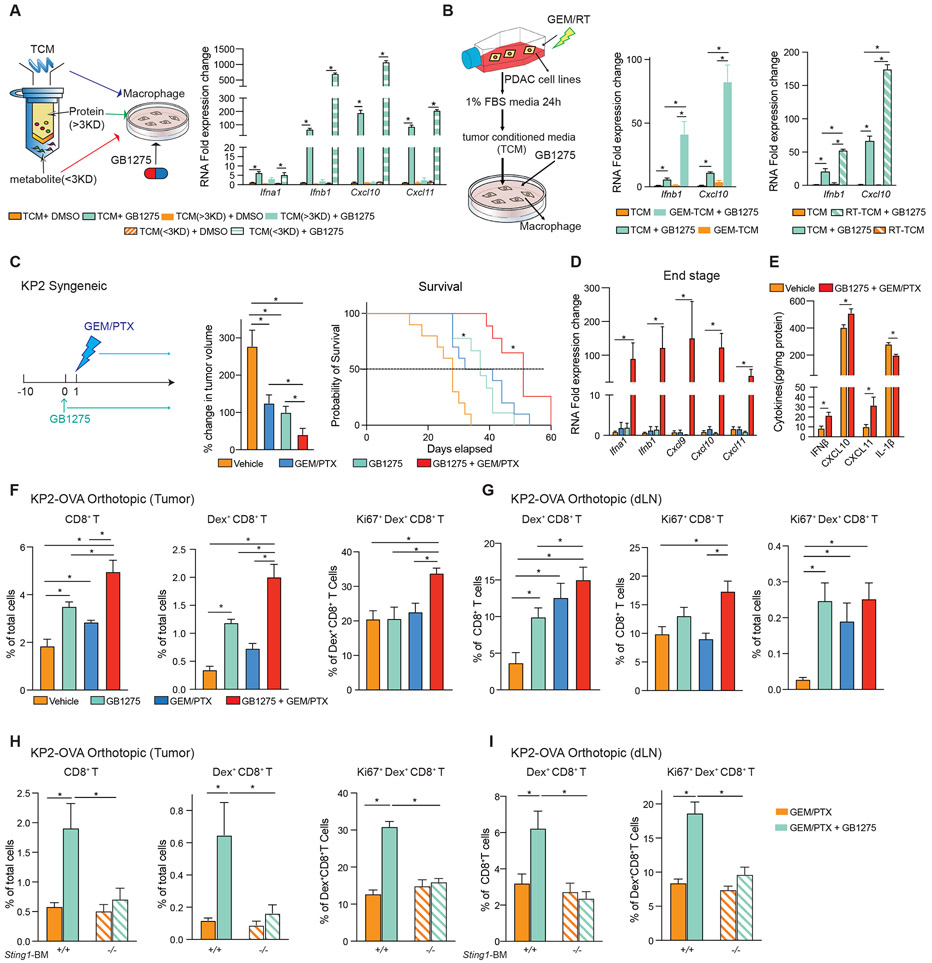
Figure 6. Chemotherapy or radiation therapy combined with GB1275, amplifies STING/IFN signaling.
(A) Concentrated protein (> 3 kDa) and metabolites (< 3 kDa) in TCM were separated by a protein concentrator (left). QPCR mRNA expression analysis of BMDMs treated with different fractions of TCM ± GB1275 for 7 hours. Changes in gene expression are depicted as the fold change from the vehicle baseline (right).
(B) KP2 cells were treated with either gemcitabine (left) or radiation (right). TCM was made from above cells. QPCR mRNA expression analysis of BMDMs treated with the above mentioned TCM ± GB1275 for 7 hours. Changes in gene expression are depicted as the fold changes from the vehicle baseline.
(C) Tumor growth of KP2 syngeneic model treated with vehicle or GB1275 ± chemotherapy (left). Mean percent change in tumor volume on day 12 (n = 9–10/group) (middle). Right, Kaplan–Meier survival analysis (n = 9–10/group).
(D) QPCR mRNA expression analysis of tissue from C (n = 6–8/group). Changes in gene expression are depicted as fold changes from the vehicle baseline.
(E) IFNβ, CXCL10, 11, and IL-1β production in tissues from a syngeneic KP2-OVA orthotopic model treated with vehicle or GB1275 + chemotherapy for 12 days. (n = 7–8 group).
(F) Syngeneic KP2-OVA orthotopic model treated with vehicle, GB1275, chemotherapy, or combination for 12 days. Frequencies of tumor-infiltrating CD8+ T cells, Dex+ CD8+ T cells, and proliferative Dex+ CD8+ T cells (n = 6/group).
(G) Frequencies of Dex+ CD8+ T cells, proliferative CD8+ T cells, and proliferative Dex+ CD8+ T cells in dLN from F.
(H) C57/BL-6 mice were lethally irradiated and adoptively transferred with BM from either wild-type mice or STING-null mice. KP2-OVA orthotopic model was established on above mice and treated with chemotherapy ± GB1275 for 12 days. Frequencies of tumor-infiltrating CD8+ T cells, Dex+ CD8+ T cells, and proliferative Dex+ CD8+ T cells (n = 6/group).
(I) Frequencies of Dex+ CD8+ T cells and proliferative Dex+ CD8+ T cells in dLN from H. The graphs show mean ± SEM; *denotes p < 0.05 using the two-sided t-test between two groups or log-rank test for Kaplan–Meier survival curves. In vitro data are representative of three independent experiments.
Also see Figure S6.

