
Figure 8.
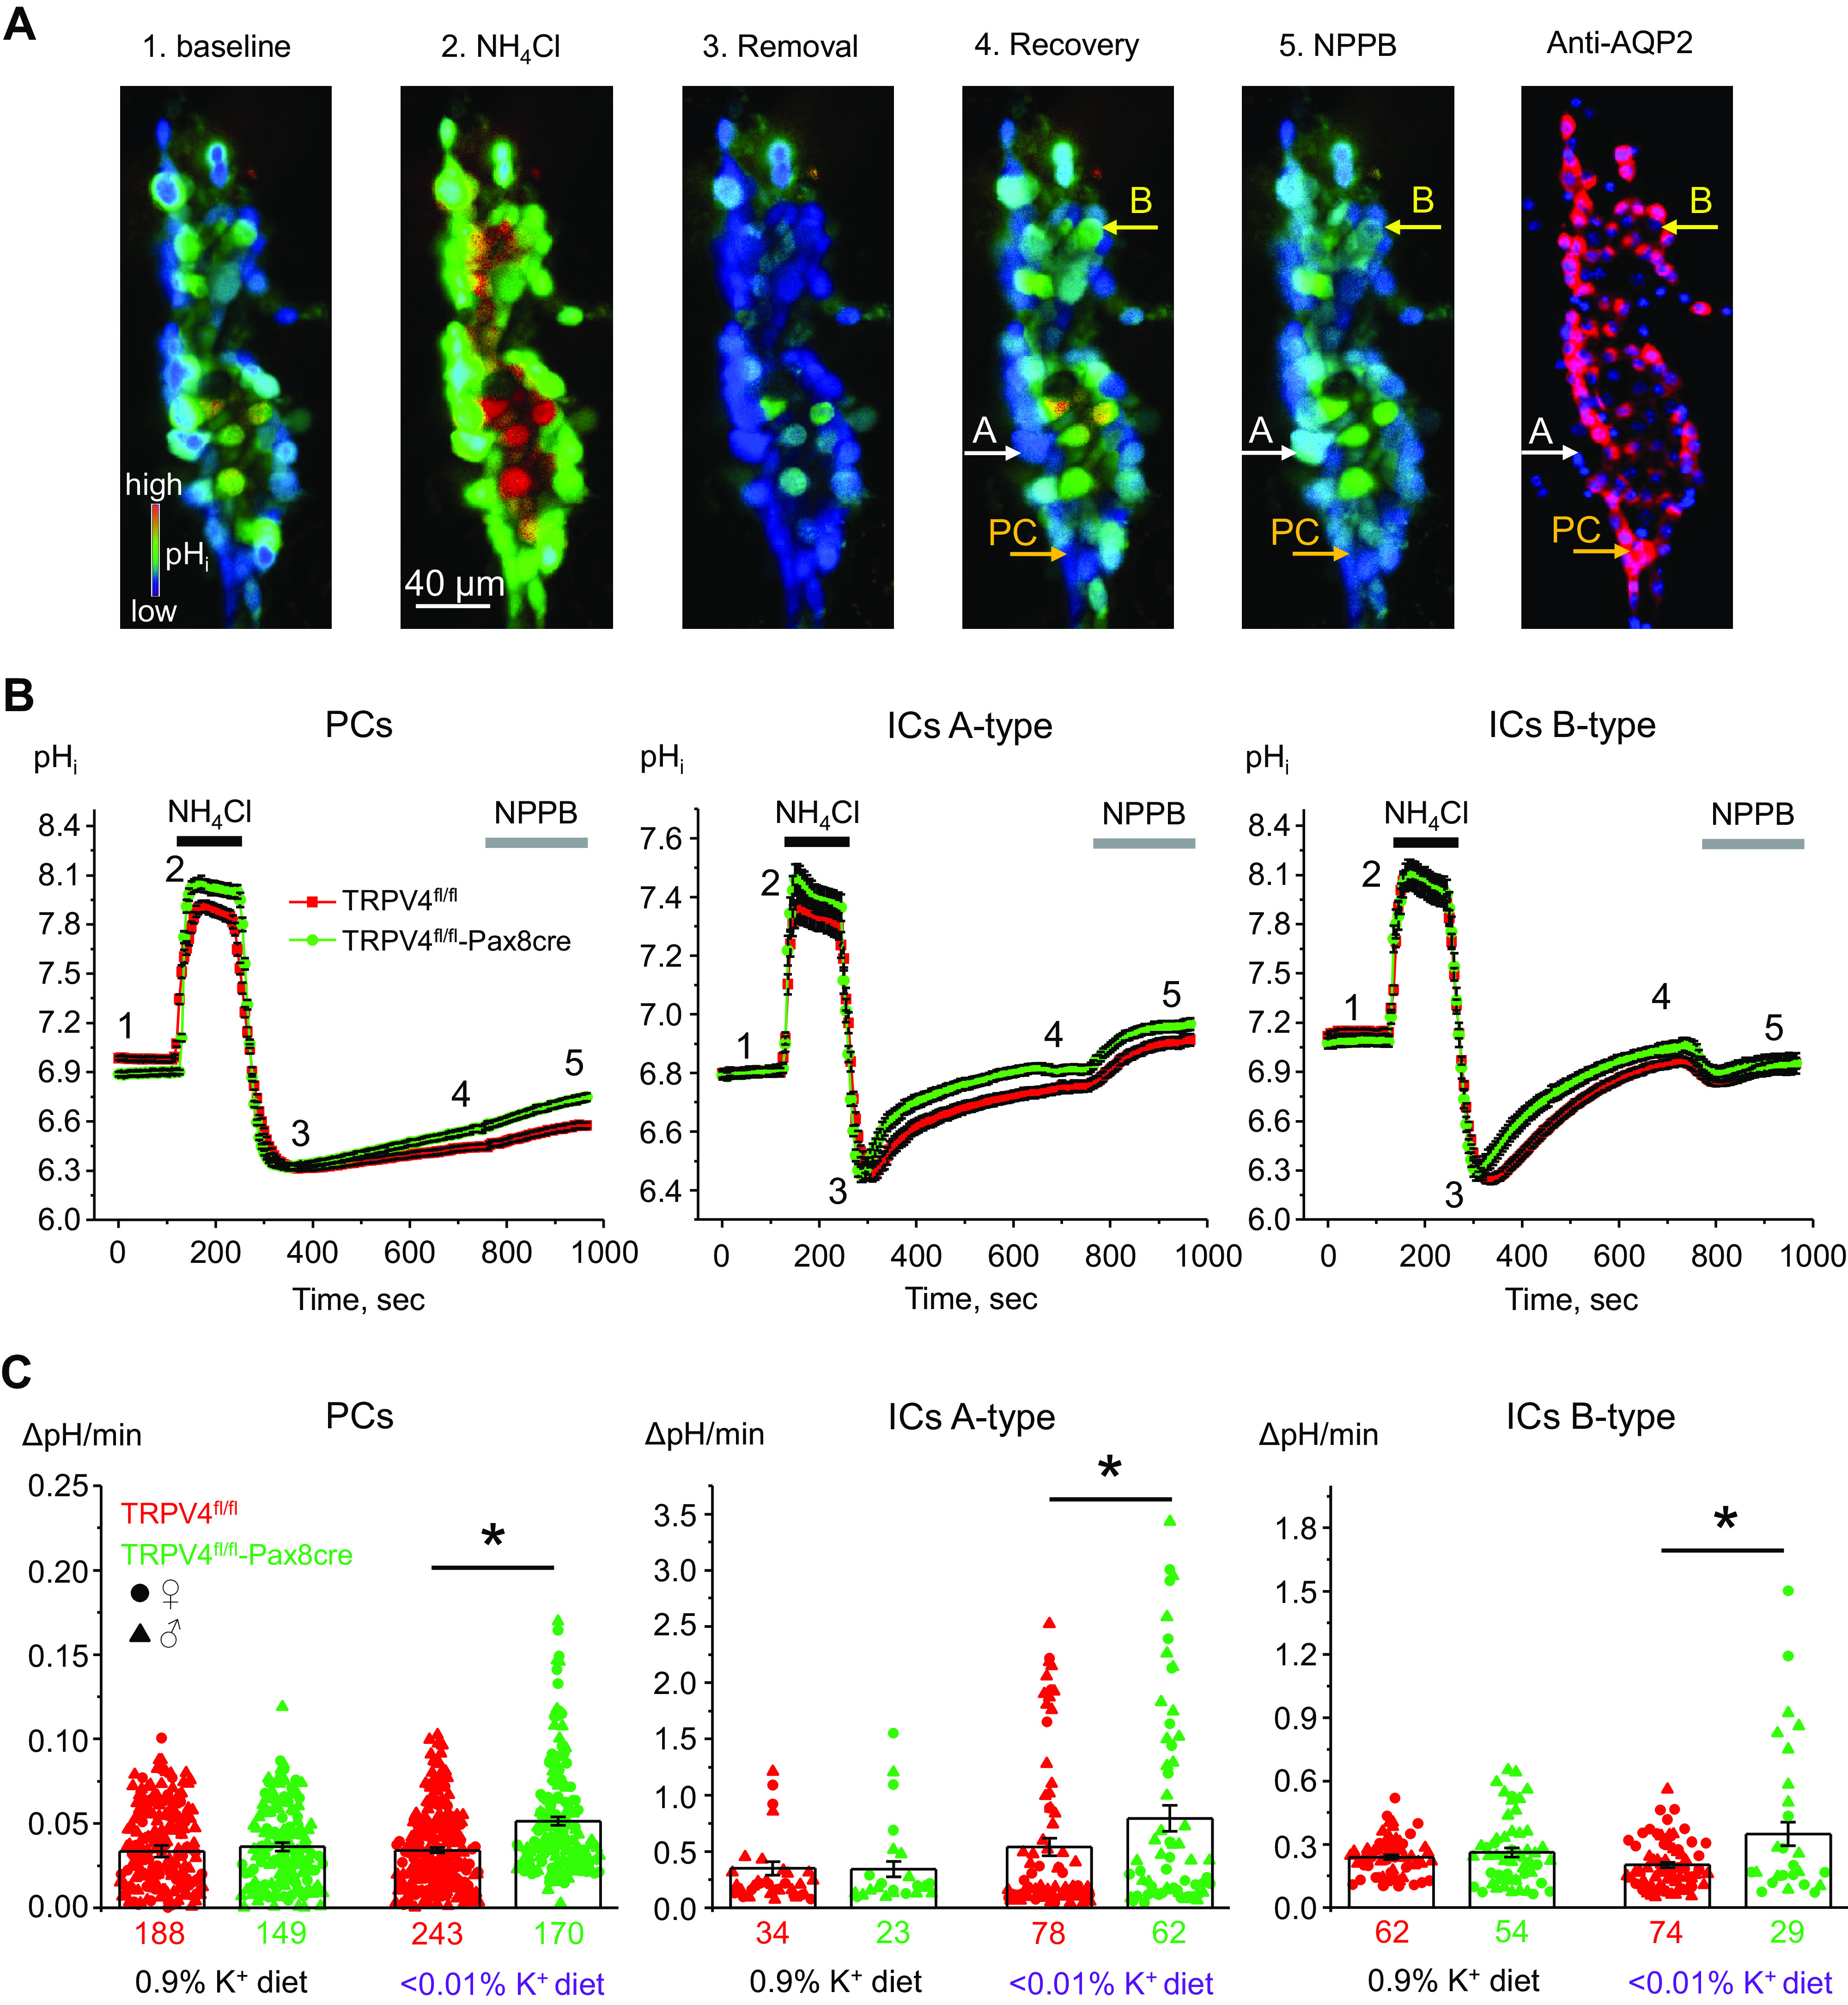
Mice with transient receptor potential vanilloid type 4 (TRPV4) deletion in the renal tubule have increased H+-K+-ATPase-mediated intracellular pH (pHi) recovery after intracellular acidification in freshly isolated split-opened collecting ducts. A: representative pseudocolor images (blue: acidic and red: alkali) of pHi in a split-opened cortical collecting duct loaded with the pH-sensitive dye 2′,7′-bis-(2-carboxyethyl)-5-(and-6)-carboxyfluorescein at baseline (44), upon application of 40 mM NH4Cl (25), immediately after NH4Cl removal (40), upon recovery to baseline pHi values (6), and following application of the ClC-K2 blocker 5-nitro-2-(3-phenylpropylamino)benzoic acid (NPPB) to distinguish A-type and B-type intercalated cells (ICs) (1). A confocal micrograph of the same split-opened collecting duct probed with anti-aquaporin-2 (AQP2; pseudocolor red) to identify principal cells (PCs) is shown on the right. Examples of A-type (responding with alkalization to NPPB) and B-type (responding with acidification to NPPB) ICs and PCs (no change in pHi to NPPB) are depicted with white, yellow, and orange arrows, respectively. Nuclear DAPI staining is shown as pseudocolor blue. B: summary graphs comparing the time course of pHi changes in PCs (left), A-type ICs (middle), and B-type ICs (right) upon application of 40 mM NH4Cl (shown by black horizontal line) and NPPB (shown by shaded horizontal bars) in cortical collecting ducts from TRPV4fl/fl mice (red dots) and TRPV4fl/fl-Pax8Cre mice (green dots) fed a low-K+ diet for 7 days. The time points shown in A are marked as 1–5. C: summary graphs of the recovery after acidification in individual PCs (right), A-type ICs (middle), and B-type ICs (right) within split-opened areas of collecting ducts from TRPV4fl/fl mice (red dots) and TRPV4fl/fl-Pax8Cre mice (green dots) fed a regular-K+ diet (0.9% K+) and low-K+ diet (<0.01% K+) for 7 days. The rate was calculated for each individual cell (shown as dots) as a linear slope of the initial pHi recovery from the lowest pHi value after 40 mM NH4Cl removal. Numbers of cells in each group are shown. In average, six different collecting ducts from three different mice of each strain were used for each condition (1 female and 2 males or 2 females and 1 male). Cells from male and female are indicated as triangles and circles, respectively. *Significant changes (P < 0.05, one-way ANOVA with a post hoc Tukey’ test) vs. the respective values of TRPV4fl/fl mice, as indicated by the horizontal bars.