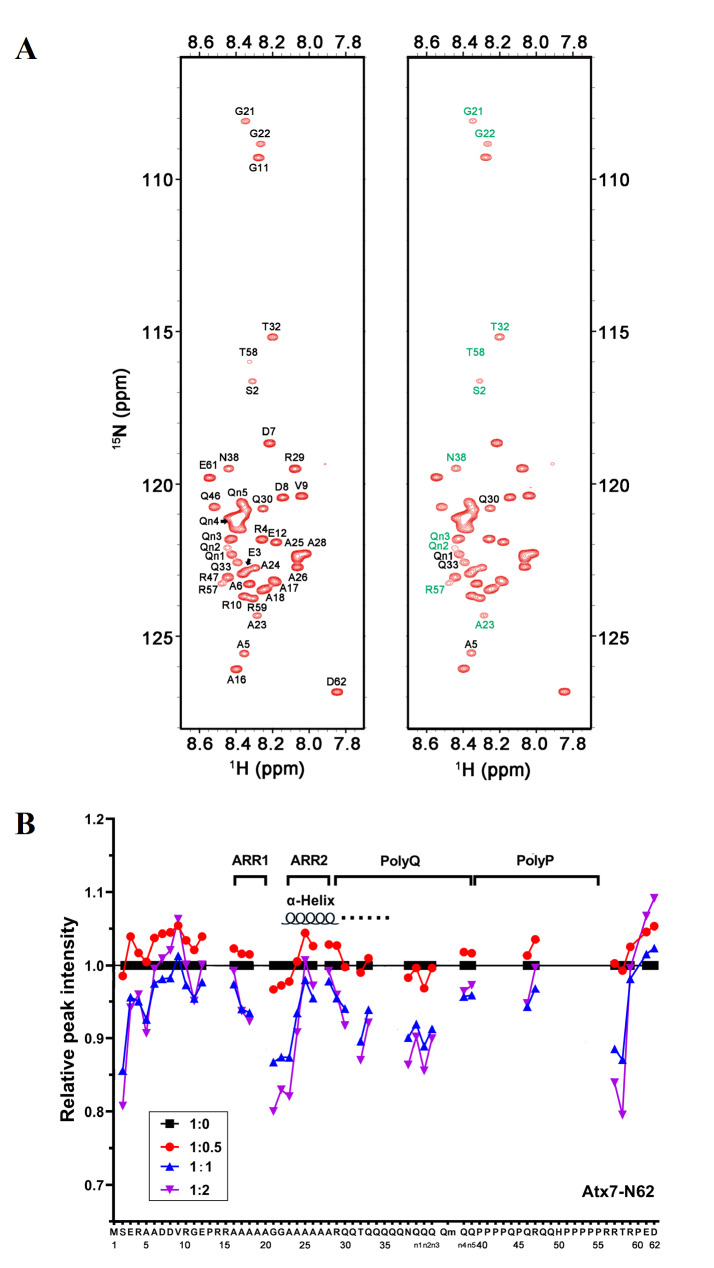
Figure 8 .
NMR titration for detecting weak interactions between polyQ proteins
(A) HSQC spectrum of 15N-labelled Atx7 22Q-N62(T3N9) with (right) or without the addition of Atx3 22Q-IIC at a molar ratio of 1:2. The residues with peak intensity changes greater than 10% are marked with green, while those greater than 8% are marked with black. (B) Plot of the relative amide peak intensity against the residue number of Atx7 22Q-N62(T3N9) in titration with Atx3 22Q-IIC. The ratios of [Atx7 22Q-N62(T3N9)]/[Atx3 22Q-IIC] were 1: 0 (black), 1: 0.5 (red), 1: 1 (blue) and 1: 2 (purple). The peak intensities (heights) were normalized as 1 for all peaks of 15N-Atx7 22Q-N62(T3N9) only (1: 0). The average of the intensities was ~0.94 (94%) at a 1:2 ratio titration.

