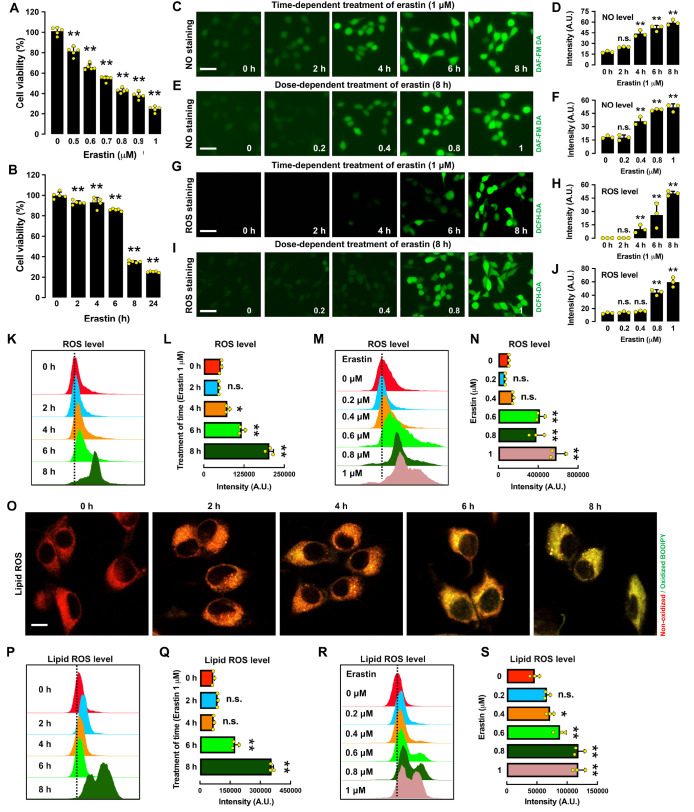
Figure 1 .
Time- and dose-dependent induction of ferroptotic cell death in erastin-treated HT22 cells
(A,B) Time- and dose-dependent effect of erastin treatment on cell viability. (C‒F) Time- and dose-dependent induction of NO accumulation following erastin treatment: fluorescence microscopy images (C,E) and respective quantitative intensity values (D,F). Note that the y-axis is the mean fluorescence intensity. Scale bar: 60 μm. (G‒J) Time- and dose-dependent induction of ROS accumulation following erastin treatment: fluorescence microscopy images (G,I) and quantitative intensity values (H,J). Scale bar: 60 μm. (K‒N) Time- and dose-dependent induction of ROS accumulation following erastin treatment: flow cytometry data (K,M) and quantitative intensity values (L,N). (O‒S) Time- and dose-dependent induction of lipid ROS accumulation following erastin treatment: confocal microscopy images (O), flow cytometry data (P,R) and quantitative intensity values (Q,S). Scale bar: 50 μm. The selected time points for the time-dependent erastin treatment in A‒S are 2, 4, 6 and 8 h, and the concentrations for the dose-dependent erastin treatment in A‒S are 0.2, 0.4, 0.8 and 1 μM. Data are presented as the mean±SE. n=3. * P<0.05, ** P<0.01 vs the control group.

