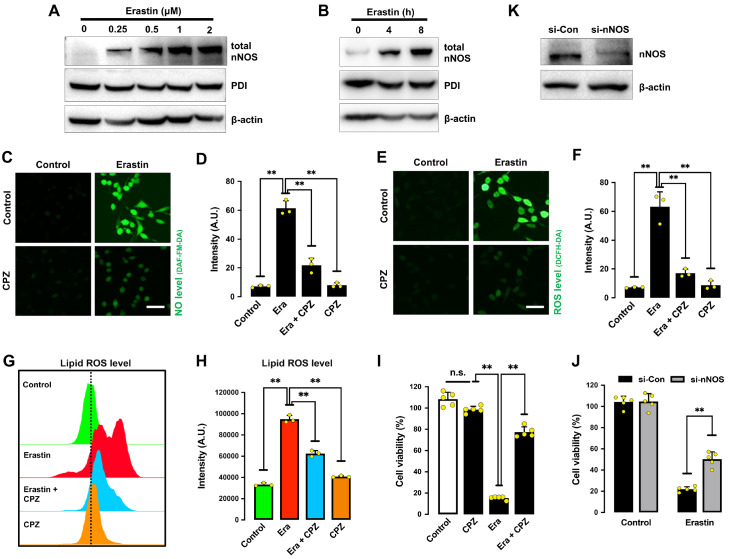
Figure 4 .
Erastin induces nNOS activation in HT22 cells
(A,B) Total nNOS levels after treatment with increasing concentrations of erastin for 8 h (A) or after treatment with 1 μM erastin for different time intervals (B). (C‒F) Levels of NO (C,D) and ROS (E,F) after treatment with 1 μM erastin± 20 μM CPZ for 8 h: fluorescence microscopy images (C,E) and fluorescence intensity values (D,F). Scale bar: 50 μm. (G,H) Levels of lipid ROS after treatment with 1 μM erastin± 20 μM CPZ for 8 h: flow cytometry data (G) and fluorescence intensity values (H). (I) Cell viability change following treatment with 1 μM erastin± 20 μM CPZ for 24 h. (J) Effect of nNOS knockdown on erastin-induced cell viability change. Cells were transfected with nNOS-siRNA for 24 h prior to treatment with 1 μM erastin for an additional 24 h. (K) Effectiveness of nNOS-siRNAs in reducing cellular nNOS protein levels. Cells were transfected with nNOS-siRNAs for 48 h, and cellular nNOS protein levels were determined by western blot analysis. Data are presented as the mean±SE. n=3. * P<0.05, ** P<0.01 vs the control group.

