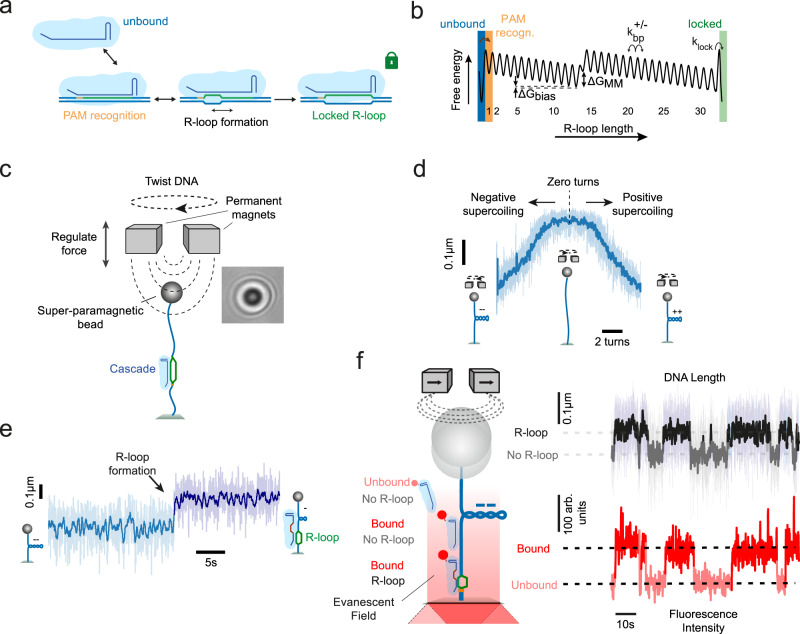
Fig. 1. Experimental setup to detect DNA binding and R-loop formation by St-Cascade.
a Scheme of target recognition by St-Cascade including PAM binding, R-loop formation and stable locking once the R-loop becomes fully extended. b Simplified 1D energy landscape for R-loop formation by St-Cascade. For states 1–32, the index corresponds to the R-loop length. Unbound, PAM-bound and locked state are indicated by colored bars. Negative supercoiling introduces a constant negative bias of per bp. A mismatch between the target strand and the guide RNA introduces a local free energy penalty . c (left) Scheme of the magnetic tweezers setup used to stretch and twist single double-stranded DNA molecules. (right) Observed diffraction pattern of a ~1 µm magnetic bead, used to track the length of the DNA molecule in real time. d DNA supercoiling curve taken at 0.3 pN, showing the characteristic DNA length reduction due to writhe formation upon negative and positive supercoiling. e Time trajectory of the DNA length including an R-loop formation event by St-Cascade seen as a sudden length increase, shown here for an R-loop length of 12 bp. Data was taken at −6 turns and 0.3 pN. f Left: scheme of the combined magnetic tweezers and TIRF microscopy measurements. Illuminating the DNA near its surface attachment with an evanescent field additionally allows us to detect binding and dissociation of St-Cascade. Right: correlated time trajectories of the DNA length monitoring R-loop formation and of the fluorescent intensity monitoring Cascade binding. In all subpanels, the shown DNA length data was taken at 120 Hz (light colors) and smoothed to 3 Hz (dark colors), while the shown fluorescence data was taken at 10 Hz.

