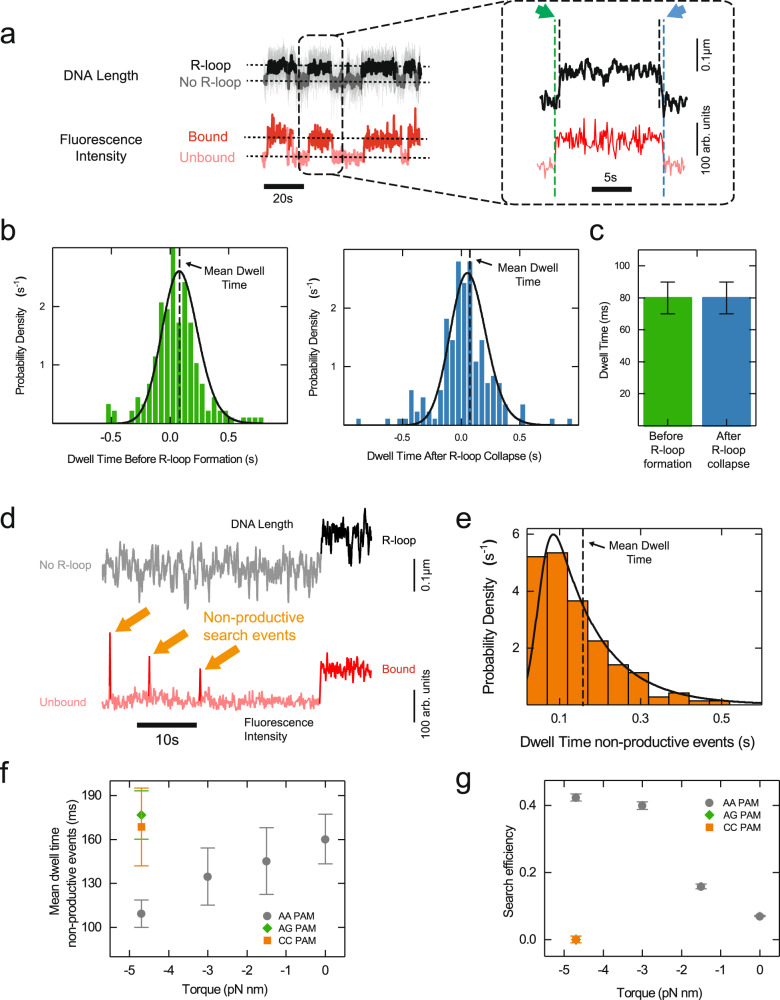
Fig. 2. Target search by St-Cascade comprises productive and non-productive search events.
a Correlated time trajectories of the DNA length and the fluorescence intensity monitoring R-loop formation and St-Cascade binding, respectively. The trajectory on the right is an enlarged view of a single R-loop formation event. Dashed vertical lines indicate the transition points in the trajectories. Colored arrows point at the dwell times before R-loop formation (green) and after R-loop collapse (blue). The trajectory was taken at 120 Hz and smoothed to 3 Hz. The fluorescence trajectory was recorded at 10 Hz. b Histograms of the measured dwell times between St-Cascade binding and R-loop formation (left, N = 173) as well as R-loop collapse and St-Cascade dissociation (right, N = 164). Black solid lines represent the maximum likelihood estimates of the data and dashed lines indicate the mean dwell times. c Mean dwell times ±SEM before R-loop formation (N = 173) and after R-loop collapse (N = 164) from maximum likelihood estimation shown in b. d Correlated time trajectories of the DNA length and of fluorescence signal revealing short non-productive search events in which St-Cascade binds to the DNA and dissociates without R-loop formation, reflected by the absence of a length change in the DNA length trajectory. The DNA length was recorded at 120 Hz and smoothed to 3 Hz, while the fluorescence trajectory was taken at 10 Hz. e Dwell time histogram of the non-productive search events for = –4.7 pN nm (F = 0.2 pN, −6 turns). The black line represents the maximum likelihood estimate of the data (N = 142). f Mean dwell times ±SEM of non-productive search events as a function of the applied torque for targets with the cognate (AAN) PAM and two non-cognate (AGN and CCN) PAMs (see Supplementary Figs. 6a–c and 8c–d for number of individual events). g Search efficiency, i.e., the percentage of R-loop forming events within all binding events, as a function of torque for targets with the indicated PAMs. Values were obtained by counting productive events relative to the total amount of productive and non-productive events. Non-productive events were corrected for short events missed by the analysis (see Supplementary Notes 3). The depicted error is calculated from the SEM of the number of missed events, obtained in the Maximum Likelihood Estimation. The numbers of counted events correspond to panels b, e and Supplementary Figs. 6a–c and 8c, d. Source Data are provided as a Source Data file.

