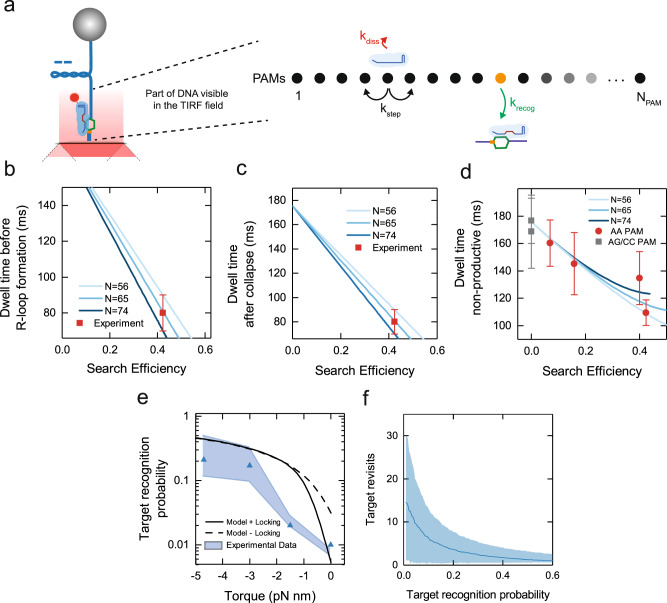
Fig. 4. St-Cascade target search modeled as a random walk on 1D lattice containing NPAM PAMs.
a Schematic representation of the target search model. b Dwell time on DNA before R-loop formation as a function of the obtained search efficiency for varying lattice sizes (solid lines). The respective mean experimental value (red square, N = 173, error corresponds to SEM) agrees with the model for a lattice size of = 65 ± 9. c Dwell time on DNA after R-loop collapse as a function of the obtained search efficiency for varying lattice sizes (solid lines). The experimental value (red square, N = 164, error corresponds to SEM) agrees with the model for a lattice size of = 65 ± 9. d Dwell times of non-productive search events modeled for varying lattice sizes as a function of the search efficiency (solid lines). For comparison, the experimental values for a cognate PAM (AAN, red circles) and two non-cognate PAMs (AGN/CCN, gray squares) are shown (see Fig. 2d for calculation and errors). e Estimated target recognition probability (per target encounter) as a function of torque. Results are shown for a lattice size of = 65 (blue triangles) where the shaded blue area represents the uncertainty given the error of = 65 ± 9. f Average number of target site revisits during a productive target search event as a function of (blue line). Site revisits were obtained from random walk simulations with 10,000 search events for each data point. Searches started at the target PAM. The blue shaded area depicts the standard deviation of the resulting distributions of target revisits. Source Data are provided as a Source Data file.

