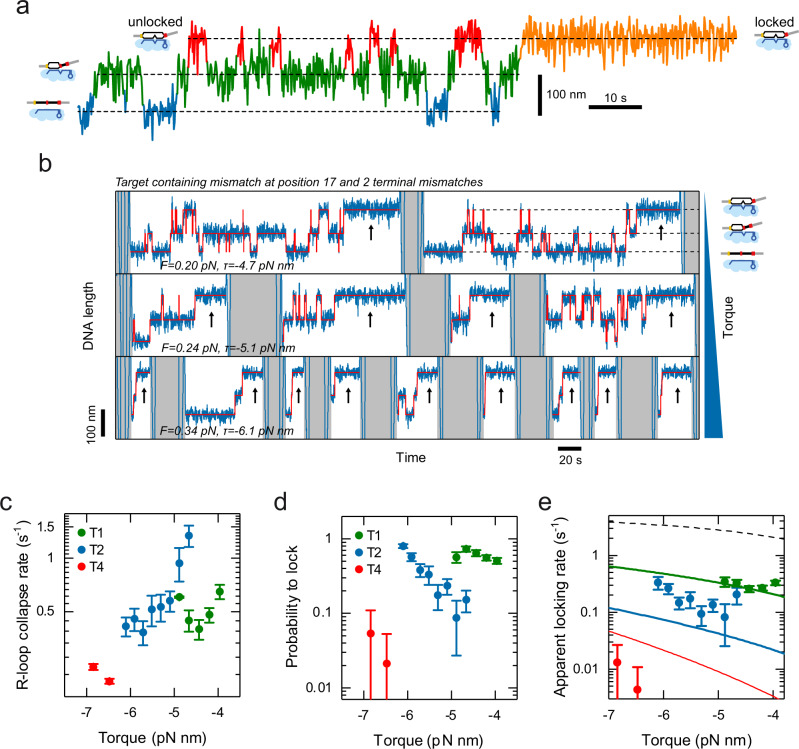
Fig. 5. Investigating the target recognition process.
a Characteristic time trajectory of transient R-loop states on a target with a mismatch at position 17 and varying numbers of PAM-distal mismatches. Visible are the unbound state (blue), the intermediate R-loop state (green), and the full R-loop states (red and orange). In the full state, the R-loop can either be unlocked such that it can collapse back to the intermediate state (red) or be stably locked (orange). b Characteristic time trajectories (blue) for a target containing a mismatch at position 17 and two PAM-distal mismatches recorded at different negative supercoiling. Idealized trajectories from Hidden Markov modeling are shown in red. The trajectories show repeated cycles of sampling the different R-loops states until locking occurs (black arrows). After each locking event, R-loop collapse and dissociation of St-Cascade is enforced by applying high positive torque (gray areas). With increasing torque, the R-loop becomes more rapidly locked. c, d The rate at which full unlocked R-loops collapse back to the intermediate state and the probability, , that an R-loop in the full state becomes locked measured for 1, 2 and 4 of terminal mismatches (T1, T2, T4) as function of torque. e The apparent locking rate, at which an R-loop in the full state becomes locked as function of torque calculated from and for the 3 different targets. The experimental data is depicted by filled circles while solid lines represent a global fit to the data according to a simple locking model (Eq. (1)). The model prediction for a target without terminal mismatches is shown as a black dashed line. All trajectories were taken at 120 Hz and smoothed to 3 Hz. The error bars correspond to the SEM. The sample sizes of the individual data points can be found in Supplementary Table 1. Source Data are provided as a Source Data file.

