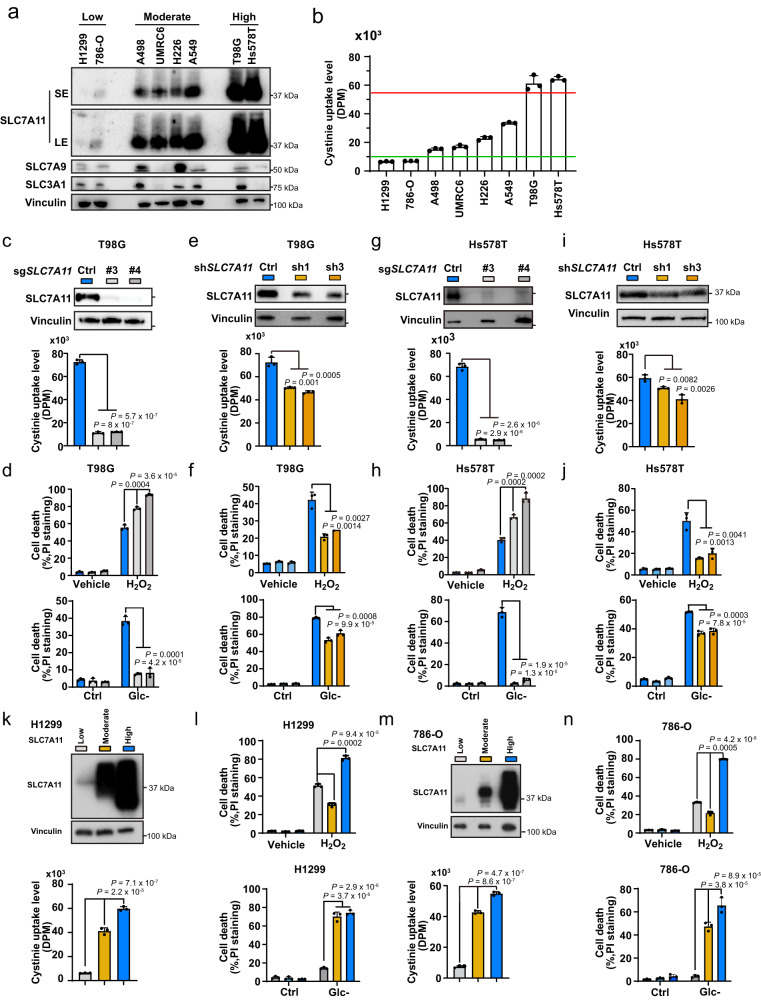
Fig. 1. Moderate and high overexpression of SLC7A11 have opposite effects on H2O2-induced cell death.
a Protein levels of SLC7A11, SLC7A9, and SLC3A1 in a panel of cancer cell lines. Vinculin was used as the loading control. b Cystine uptake levels in a panel of cancer cell lines. c Protein levels of SLC7A11 (up) and cystine uptake levels (down) in sgCtrl and SLC7A11 knockout T98G cells. d Cell death in response to 1 mM H2O2 treatment (up) or glucose starvation (down) in T98G cells with indicated genotypes for 24 h was measured using PI staining. e Protein levels of SLC7A11 (up) and cystine uptake levels (down) in shCtrl and SLC7A11 knockdown T98G cells. f Cell death in response to 1 mM H2O2 treatment (up) or glucose starvation (down) in T98G cells with indicated genotypes for 24 h was measured using PI staining. g Protein levels of SLC7A11 (up) and cystine uptake levels (down) in sgCtrl and SLC7A11 knockout Hs578T cells. h Cell death in response to 1 mM H2O2 treatment (up) or glucose starvation (down) in Hs578T cells with indicated genotypes for 24 h was measured using PI staining. i Protein levels of SLC7A11 (up) and cystine uptake levels (down) in shCtrl and SLC7A11 knockdown Hs578T cells. j Cell death in response to 1 mM H2O2 treatment (up) or glucose starvation (down) in Hs578T cells with indicated genotypes for 24 h was measured using PI staining. k Protein levels of SLC7A11 (up) and cystine uptake levels (down) in SLC7A11-low, -moderate, and -high H1299 cells. l Cell death in response to 1 mM H2O2 treatment (left) or glucose starvation (right) for 20 h in SLC7A11-low, -moderate, and -high H1299 cells was measured using PI staining. m Protein levels of SLC7A11 (up) and corresponding cystine uptake levels (down) in SLC7A11-low, -moderate, and -high 786-O cells. n Cell death in response to 1 mM H2O2 treatment (left) or glucose starvation (right) in SLC7A11-low, -moderate, and -high 786-O cells for 20 h measured using PI staining. Data were presented as mean ± SD; n = 3. n indicates independent repeats. P value was determined by two-tailed unpaired Student’s t test. Source data are provided as a Source Data file.

