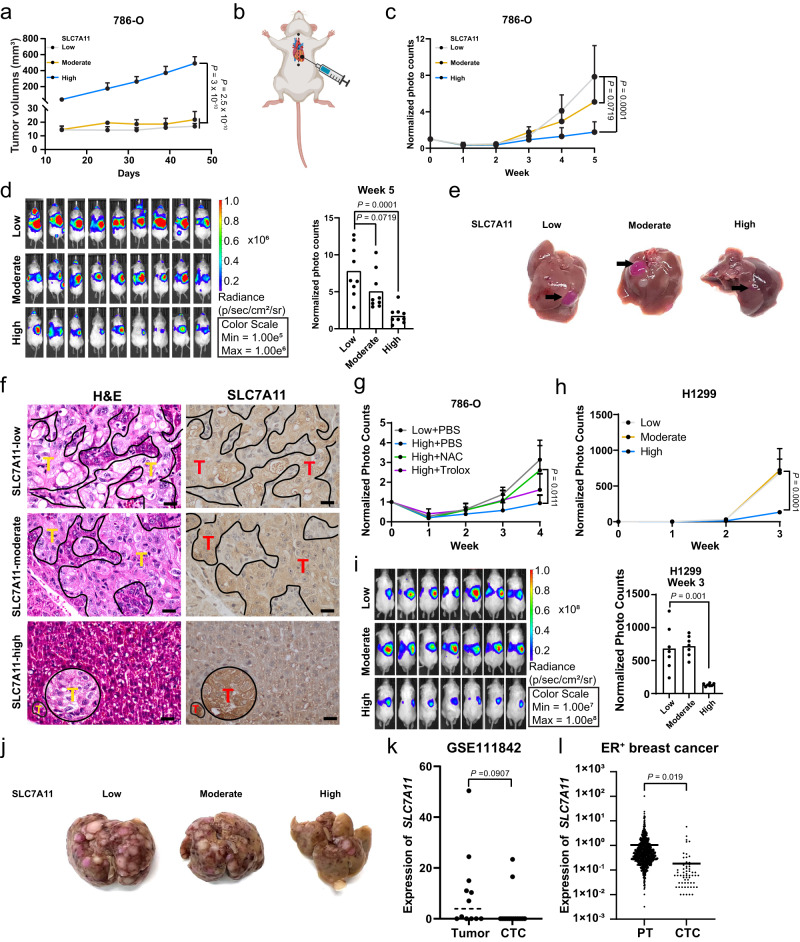
Fig. 5. High overexpression of SLC7A11 promotes primary tumor growth but suppresses tumor metastasis.
a Measurement of tumor volumes of indicated 786-O xenograft tumors after subcutaneous injection (n = 8 mice). b Schematic showing the method of intracardiac injection in mice. c Quantification of photon flux (photons per second) in mice normalized to day 0 after intracardiac injection of indicated 786-O cells (n = 9 mice). d Images of bioluminescence in mice 5 weeks after intracardiac injection of indicated 786-O cells (left) and statistical analysis of the whole-body photon flux (photons per second) (right) (n = 9 mice). e Representative images of liver metastasis from SLC7A11-low, -moderate, and -high 786-O cells. f Representative images of hematoxylin and eosin (H&E) and immunohistochemical staining (SLC7A11) of livers with tumor metastasis derived from indicated 786-O cells. Scale bars, 20 μm. “T” stands for tumor cells. g Quantification of photon flux in mice normalized to day 0 after intracardiac injection of SLC7A11-low 786-O cells with PBS and -high 786-O cells treated with PBS, NAC, or Trolox (n = 4 mice for Low + PBS and High + Trolox groups, n = 5 mice for High + PBS and High + NAC groups). h Quantification of photon flux in mice normalized to day 0 after intracardiac injection of indicated H1299 cells (n = 7 mice). i Images of bioluminescence in mice 30 min after intracardiac injection of indicated H1299 cells (left) and statistical analysis of whole-body photon flux (right). (n = 7 mice). j Representative images of liver metastasis from SLC7A11-low, -moderate, and -high H1299 cells. k Analysis of SLC7A11 expression levels between breast primary tumors and circulating tumor cells (CTCs) from matched patients with stage II-III breast cancer (GSE111842; n = 12 for primary tumors and n = 16 for CTCs). l Analysis of SLC7A11 expression in estrogen receptor–positive (ER+) breast primary tumors (PTs; from The Cancer Genome Atlas) and CTCs (GSE75367 and GSE86978; n = 1015 for PTs and n = 99 for CTCs). Data were presented as mean ± SD. P value was determined by two-tailed unpaired Student’s t test. n.s. not significant. Source data are provided as a Source Data file.

