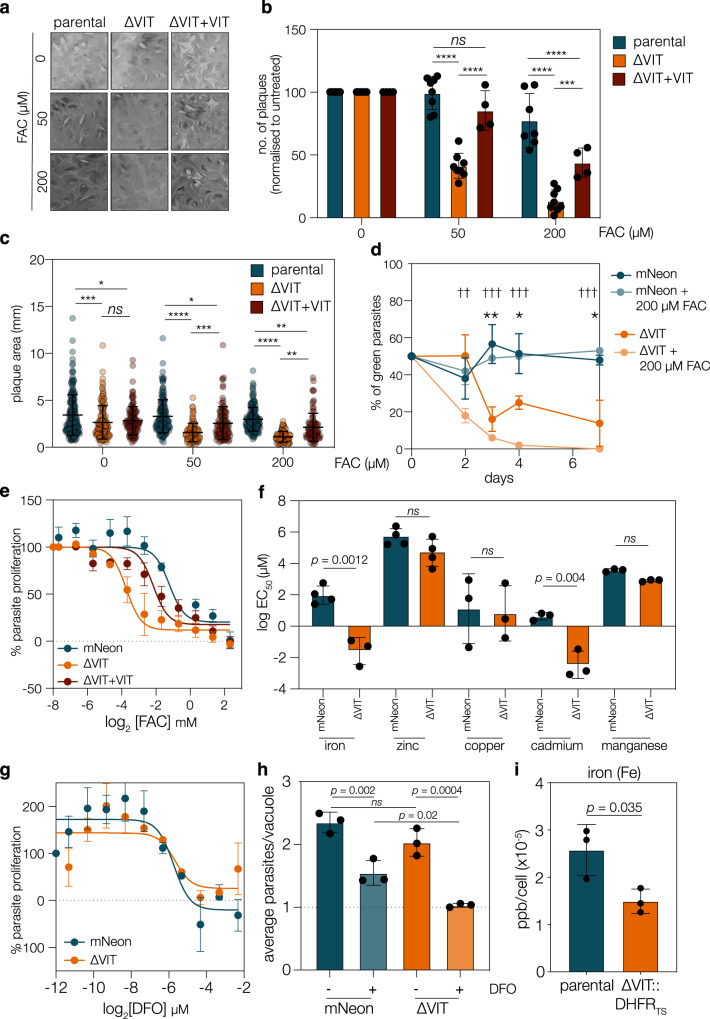
Fig. 2. ΔVIT parasites are more susceptible to iron overload.
a Plaque assay with indicated concentrations of FAC (ferric ammonium chloride). ΔVIT parasites more susceptibile to exogenous iron, somewhat complemented by re-expression of VIT. b Quantification of number of plaques (normalised to the untreated) for parental, ΔVIT and ΔVIT + VIT parasites after 0, 50 or 200 μM FAC treatment. Results from 3 (ΔVIT + VIT), 6 (ΔVIT) or 8 (parental) independent experiments, bar at mean ± SD, p values from two-way ANOVA, Tukey corrected for multiple comparisons. ***p = 0.0002, ****p < 0.0001. c Plaque area for experiments above, p values from one-way ANOVA, Tukey corrected for multiple comparisons d tdTomato parasites were mixed with mNeon and ΔVIT parasites in a 1:1 ratio and untreated or treated with 200 μM FAC. ΔVIT parasites were significantly outcompeted by 3 days post infection, or 2 days in the presence of excess iron. Points are the mean of n = 4, ±SD. **p = 0.001 **p = 0.003, ***p = 0.0006, t test between mNeon and ΔVIT, †† p = 0.001, ††† p < 0.0001, t test between mNeon +200 μM FAC and ΔVIT + 200 μM FAC, all two tailed t test, corrected for multiple comparisons by two-stage step-up (Benjamini, Krieger, and Yekutieli) e Dose-response curve showing ΔVIT parasites more sensitive to FAC that the parental, complemented line shows partial rescue. Points are the mean of n = 4 (mNeon) or 3 (ΔVIT and ΔVIT + VIT) independent experiments, ± SEM. f Graph showing mean EC50 for indicated metals for mNeon and ΔVIT parasites, each point represents a biological replicate, performed in triplicate. Bars at mean, ±SD. p values from two tailed t test. g ΔVIT parasites did not show any significant change in the EC50 upon DFO treatment. Results are n = 3, ± SEM. h mNeon and ΔVIT parasites were allowed to invade HFF cells untreated, or pretreated with DFO for 24 h. At 14 h post invasion, average parasite/vacuole were quantified. Results mean of n = 3 ± SD, at least 100 vacuoles counted/experiment. p values from one way ANOVA with Holm-Sidak correction. i ICP-MS quantification from parental and ∆VIT::DHFRTS parasites. Bars are at the mean of n = 3, ±SD, p value from two tailed t test.

