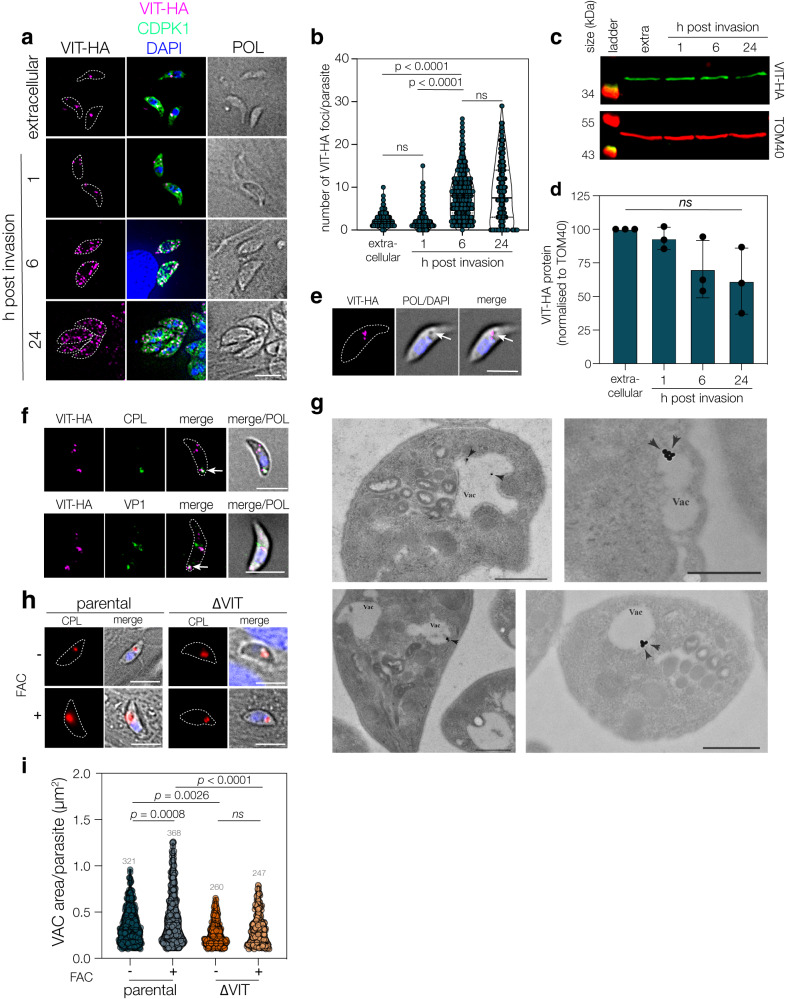
Fig. 3. VIT has a dynamic localisation which alters through the lytic cycle.
a IFA of VIT-HA showing a dynamic localisation through the lytic cycle, VIT-HA exists at a single point in extracellular and 1 h post-invasion parasites before fragmenting at 6–24 h post invasion to a few small foci throughout the parasite. POL polarised light. Scale bar 5 μm. b Violin plot of number of foci/parasite from 3 independent replicates, 100 parasites/replicate. Bars at mean and quartiles. p values from one way ANOVA with Holm-Sidak correction. c Western blot showing VIT-HA at indicated time points, TOM40 used as a loading control. d Quantification of VIT-HA levels from three independent experiments, bar at mean ± SD, ns no significant change. e Extracellular VIT-HA parasites demonstrating co-localisation of VIT-HA with a vacuole visible by phase contrast (arrow). Representative of two independent experiments. Scale bar 5 μm. f VIT-HA overlaps with the PLVAC markers CPL and VP1 in extracellular parasites. Representative of three independent experiments. g Extracellular VIT-HA parasites imaged by immunoelectron microscopy. VIT-HA signal was frequently seen at the vacuole (VAC). Scale bar 500 nm. Representative of two independent experiments. h Parental and ΔVIT parasites, allowed to invade and treated for 1 h with excess FAC, were stained with anti-CPL, a marker for the VAC. Parental, but not ΔVIT parasites showed a swelling of the VAC. Scale bar 5 μm. i Violin plot of area of the PLVAC (as assessed by CPL staining) from the above experiment. Results of two independent replicates, n parasites indicated above plot, bar at mean ± quartiles. p values from one way ANOVA with Holm-Sidak correction.

