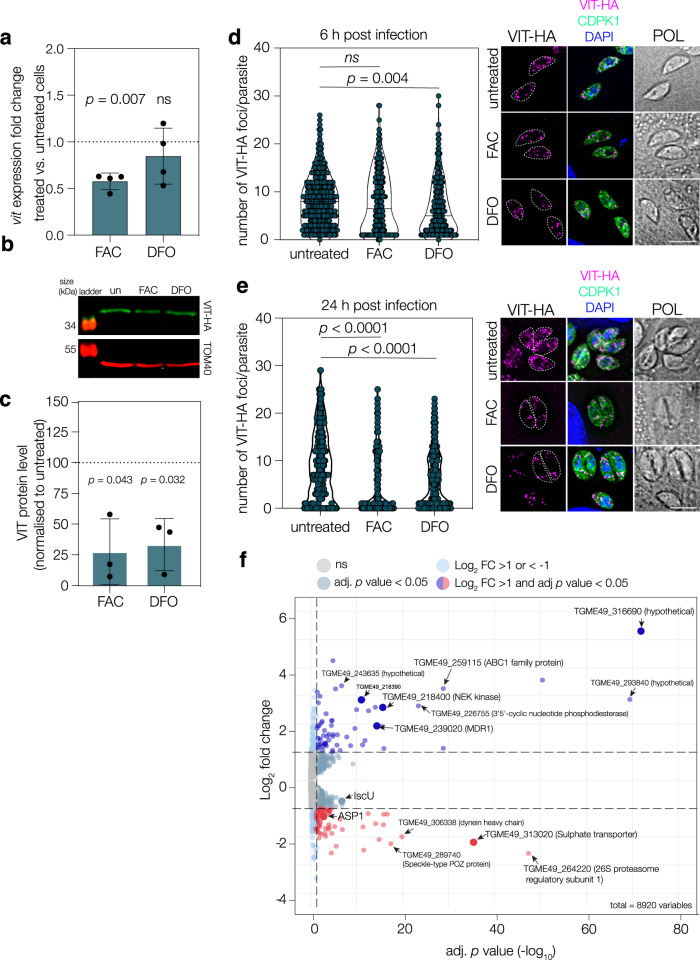
Fig. 4. VIT expression is regulated by the changes in iron levels.
a qRT PCR on vit transcripts after treatment with FAC or DFO, normalised to actin. Points represent 4 independent experiments, bars at mean ± SD. p values from two tailed one sample t-test. b Western blot showing levels of VIT-HA after 24 h treatment with 100 μM DFO or 5 mM FAC. TOM40 used as a loading control. c Quantification of VIT-HA levels from three independent experiments, bar at mean ± SD, p values from one sample two tailed t test. d VIT-HA foci at 6 h post invasion after treatment with FAC or DFO. There was no significant change upon FAC treatment, however, there was a significant decrease in the number of foci upon DFO treatment. POL polarised light. Results from 3 independent experiments, n = 300 parasites. p values from one way ANOVA with Tukey correction. e As above, but quantified at 24 h post invasion. There was a significant decrease in the number of foci after treatment with both FAC and DFO, p values from one way ANOVA with Tukey correction. Results from 3 independent experiments, n = 300 parasites. p values from one way ANOVA with Tukey correction. f Volcano plot from RNAseq data comparing the parental line to ΔVIT. Adjusted p values from Wald test with Benjamini and Hochberg correction. See text for more details.

