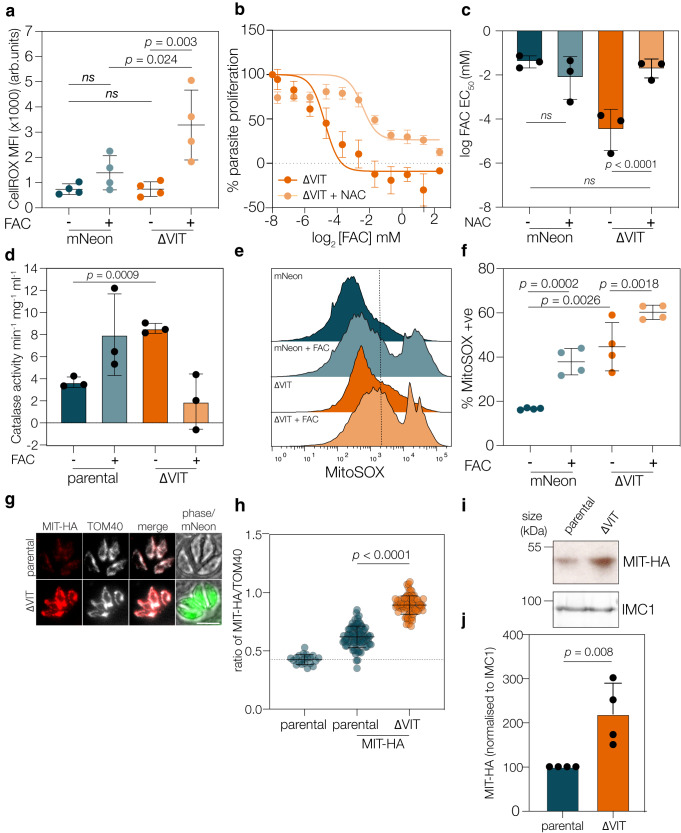
Fig. 5. Iron overload in absence of VIT leads to ROS accumulation.
a mNeon and ΔVIT parasites were treated with FAC and CellROX Deep Red fluorescence quantified using flow cytometry. FAC-treated parental cells had no significant effect on CellROX fluorescence, however, in ΔVIT parasites, CellROX was significantly (p = 0.004, one way ANOVA with Sidak correction) increased. Each point represents geometric mean fluorescence of over 10,000 cells from n = 4, ns not significant. Bars are at mean, ±SD. b Treatment with NAC (5 mM) rescued ΔVIT parasite hypersensitivity to FAC. Points are the mean of n = 3, ±SEM. c Graph showing the mean EC50 for FAC of mNeon and ΔVIT parasites, with or without NAC treatment. Each point represents an individual experiment, bars at the mean of n = 3, ±SD. p values from two sided extra sum of square F test. d ΔVIT parasites had significantly higher catalase activity compared to the parental line. Each point represents an independent experiment, n = 3, bar at mean ± SD. p value from one way ANOVA with Sidak correction. e mNeon and ΔVIT parasites were treated as in (a), and MitoSOX fluorescence quantified. Overlapping histogram from a single experiment showing change in fluorescence distribution. f Percentage of cells MitoSOX positive from four independent experiments, bars at the mean ± SD. p value from one way ANOVA with Tukey correction. g Immunofluorescence showing localisation and expression of parental and ΔVIT parasites endogenously expressing MIT-HA. Scale bar 5 um. h Quantification of MIT-HA signal as a ratio of TOM40. Points represent individual vacuoles from n = 3, bar at mean ± SD. p value from one way ANOVA with Tukey correction. i Western blot confirming the increased expression of MIT-HA in the ΔVIT parasites compared to the parental line, IMC1 used as loading control. Representative of 4 independent experiments. j Quantification of MIT-HA expression, normalised to loading control. Bar at mean ± SD, n = 3 individual biological replicates. p value from two tailed one sample t test.

