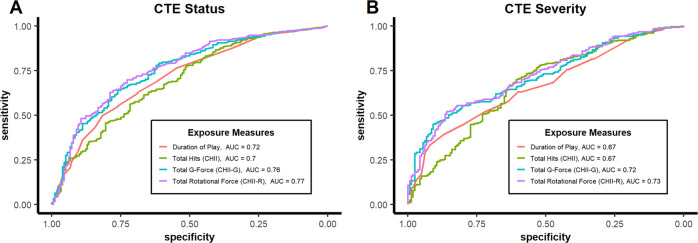
Fig. 2. Performance of Exposure Measures as Classifiers of CTE Pathology.
ROC Curves for Exposure Measures as Predictors of CTE Status (A) and CTE Severity (B). Source data are provided as a Source Data file. AUC area under the ROC curve, CHII cumulative head impact index representing estimated number of head impacts per donor, CHII-G cumulative head impact index representing estimated cumulative g-force experienced by each donor, CHII-R cumulative head impact index estimated cumulative rotational force experienced by each donor, CTE chronic traumatic encephalopathy, ROC receiver operating characteristics.

