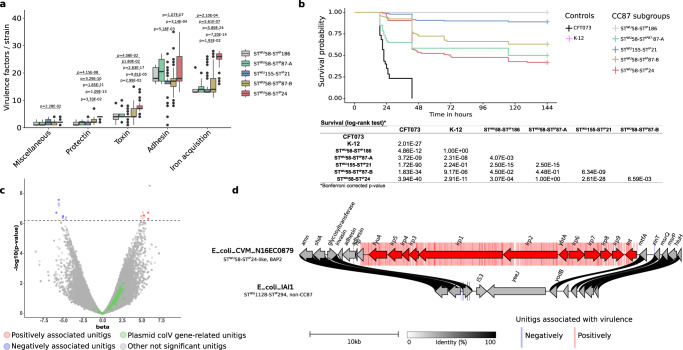
Fig. 2. From genotypic and phenotypic characterization of CC87 extra-intestinal virulence to identification of genetic determinants by GWAS in the 232 B1 phylogroup CC87 strains.
a Number of virulence-associated genes per strain among the six main functional classes of virulence according to CC87 subgroups (n = 232 biologically independent CC87 genomes) (Kruskal-Wallis test with Bonferroni adjusted p-values). Only significant p-values are shown. The upper and lower limits of box-plots represent 75th and 25th quartile, the centre line represents the median and the whiskers extend to 1.5 × IQR. Dots represent values outside these ranges. b Kaplan-Meier survival curves of the mouse sepsis assay. Note that the pink (K-12) and gray (STWU58-STIP186) curves overlap. The table below the curves shows the log rank results to compare survival according to CC87 subgroups. c Results of the unitigs association with virulence (likelihood ratio test). The p-value of the association is shown on the y-axis, the effect size (beta) on the x-axis and the significance level with a dotted line (Bonferroni multiple-testing corrected p-value). The unitigs positively and negatively associated with the phenotype are highlighted in red and blue, respectively. The unitigs found in genes belonging to the ColV plasmid (as described by Reid et al.19) are highlighted in green. Other non-significant unitigs are in gray. d Physical map of the genome region where significant associations with the virulence in mice were observed. Unitigs positively or negatively associated are represented in the background of the map by red and blue bars, respectively. Genes positively associated with virulence are represented by red arrows and include the whole HPI. The fully sequenced and circularized genomes of E. coli CVM_N16EC0879 (STWU58-STIP24-like, BAP2 in the study by Reid et al.19) and IAI1 (STWU1128-STIP294, non-CC87) were used as reference. The links between the maps are colored according to amino acid identity.

