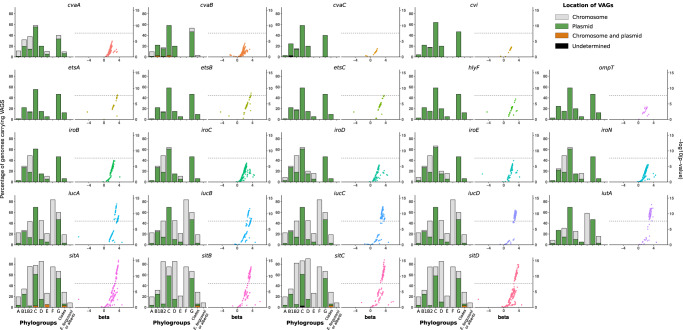
Fig. 3. Prevalence and location of VAGs and association between virulence and unitigs within these VAGs among 370 genomes of the Escherichia genus.
For each VAG two plots are represented. The bar plot represents the prevalence according to the phylogroup/genus and the predicted location. Plasmidic location is highlighted in green, chromosomal location in gray and cases with both chromosomal and plasmidic location in orange. Location of VAGs could not be determined in two genomes (cvaC in phylogroup B1 and sitC in phylogroup C) and is shown in black. The whole dataset is composed of genomes of strains from phylogroup A (n = 72), B1 (n = 41), B2 (n = 111), C (n = 36), D (n = 20), E (n = 19), F (n = 12), G (n = 15), clades (n = 32) and E. fergusonii and E. albertii (n = 12). The scatter plot represents the association between unitigs within the VAGs and the virulence in mice (likelihood ratio test). The p-value is shown on the y-axis, the effect size (beta) on the x-axis and the significance level of the GWAS analysis with a dotted line (Bonferroni multiple-testing corrected p-value).

