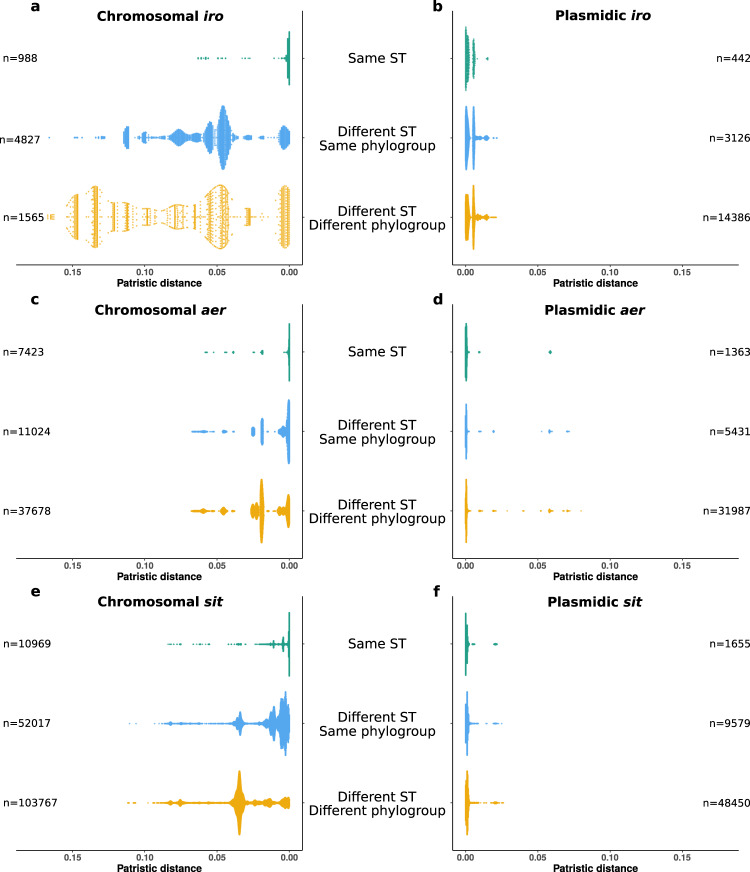
Fig. 6. Distributions of patristic distances between iro, aer and sit operons according to their location and to the sequence types and phylogroups of the strains.
The scatter plots represent the patristic distances between pairs of (a) chromosomal iro operons, (b) plasmidic iro operons, (c) chromosomal aer operons, (d) plasmidic aer operons, (e) chromosomal sit operons and (f) plasmidic sit operons. The number of pairs of genomes involved in each category is specified opposite each scatter plot. For the sake of readability, the highly divergent sequences of chromosomal aer from genomes GCF_010725305.1 and GCF_002946715.1 and chromosomal sit from genome GCF_024225755.1 were not included.

