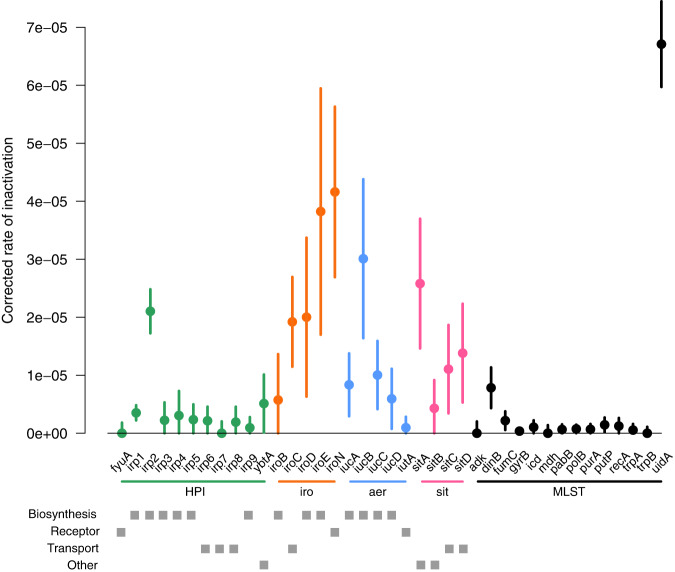
Fig. 7. Corrected inactivation rate of HPI (green), iro (orange), aer (blue) and sit (pink) operon genes and of MLST control genes (black) (n = 2302 biologically independent E. coli genome).
For each gene we show the corrected inactivation rate (circles at the centre of error bars) and the 95% binomial confidence interval (error bars) computed by approximating the distribution of error with a normal distribution, and using the rule of three for rates equal to 0. The inactivation rate is the number of strains with at least one inactivation over the number of strains carrying the gene and gene length. The gray squares indicate the gene function category (biosynthesis, receptor, transport and other). Note the high inactivation of the uidA gene previously reported34,35.

