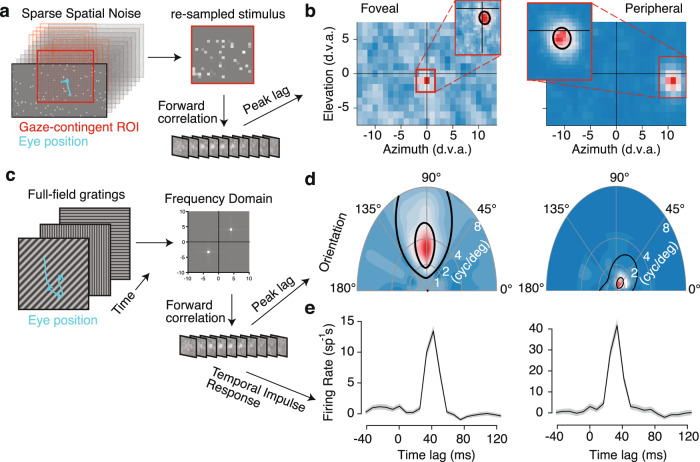
Fig. 2. Receptive field mapping and feature tuning in V1.
a Retinotopic mapping approach uses a 28 × 16° gaze-contingent grid with 1° spacing. This downsampled stimulus is used to estimate the receptive field (RF) using linear regression with binned spike counts. b The spatiotemporal RF at the peak lag is shown as a heatmap for foveal and peripheral example units. A region of interest (ROI) is set around the peak value in the RF map. This ROI is used to repeat the analysis at a .3° resolution, which is shown in the insets. The black line denotes a contour from Gaussian fit at 2 standard deviations. c Subspace reverse correlation procedure for mapping tuning. Full-field gratings are updated randomly at or near the frame rate. Linear regression is used to map from the frequency subspace to firing rates. The resulting spatiotemporal weights are used to learn the tuning and temporal impulse response. d Example joint orientation-frequency tuning maps for the units in panel b. Black lines indicate 50 and 75% contour lines from the parametric fit (methods). e Temporal impulse response in spikes per second for preferred gratings measured with forward correlation.

