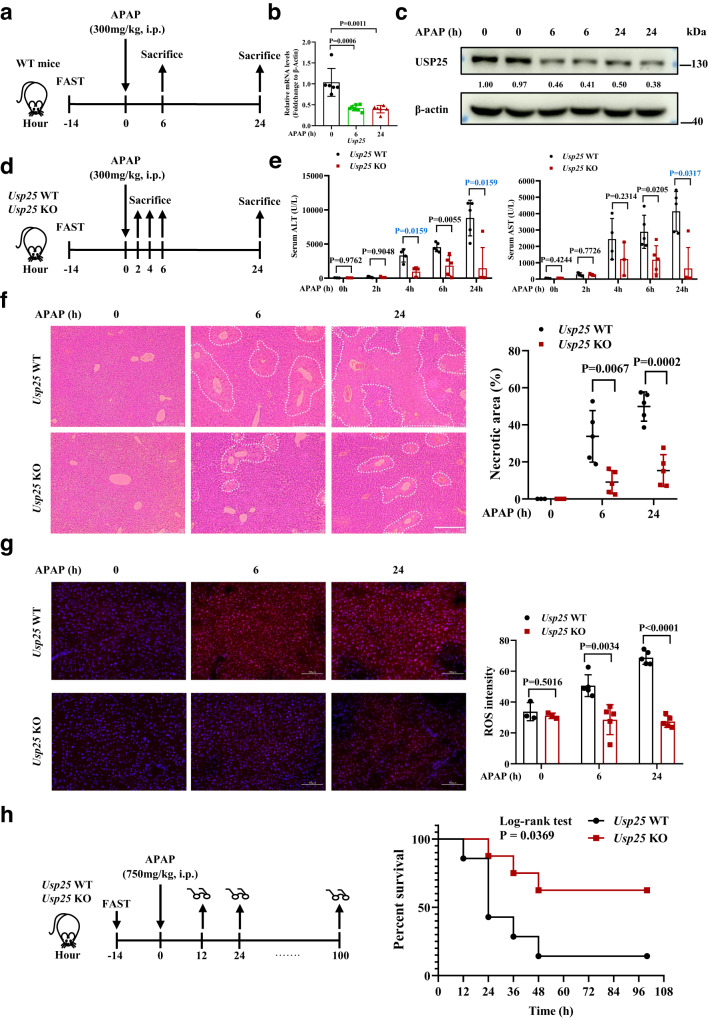
Fig. 1. The loss of Usp25 protects the liver from APAP-induced injury.
a The scheme of APAP treatment. Male C57BL/6 mice were fasted for 14 h, treated with APAP (300 mg/kg, i.p.), and sacrificed at 0, 6 or 24 h after APAP administration. b Quantification of Usp25 expression in the liver from the animals of (a) via qPCR. 0 h: n = 6 mice, 6 h: n = 7 mice, 24 h: n = 6 mice. c Quantification of Usp25 expression in the liver from the animals of (a) via western blotting. The numbers are normalized relative expression of USP25. d The scheme of APAP treatment in Usp25+/+ and Usp25−/− male mice. The animals were fasted for 14 h, treated with APAP (300 mg/kg, i.p.), and sacrificed at 0, 2, 4, 6 or 24 h after APAP administration. e Serum ALT and AST levels were determined in mice from (d). Usp25 WT: 0 h: n = 3 mice, 2 h: n = 5 mice, 4 h: n = 4 mice, 6 h: n = 5 mice, 24 h: n = 5 mice, Usp25 KO: 0 h: n = 3 mice, 2 h: n = 4 mice, 4 h: n = 3 mice, 6 h: n = 5 mice, 24 h: n = 5 mice. f Hematoxylin and eosin staining of the liver sections from mice in (d). Necrotic areas were encircled and quantified. 0 h: n = 3 mice, 6 h: n = 5 mice, 24 h: n = 5 mice. Scale bar, 200 μm. g Immunofluorescence analysis of ROS in frozen liver sections from mice in (d). 0 h: n = 3 mice, 6 h: n = 5 mice, 24 h: n = 5 mice. Scale bar, 100 μm. The fluorescent signal strength was quantified with Image J. At least 3 view fields under a 20x objective were quantified per section. h The treatment scheme and survival of Usp25+/+ and Usp25−/− mice treated with APAP (750 mg/kg, i.p.). Usp25 WT: n = 7 mice, Usp25 KO: n = 8 mice. Error bars denote SEM. Two-tailed student’s t tests analysis (b, e, f and g), non-parametric tests with blue colored (e). Source data are provided as a Source Data file.

