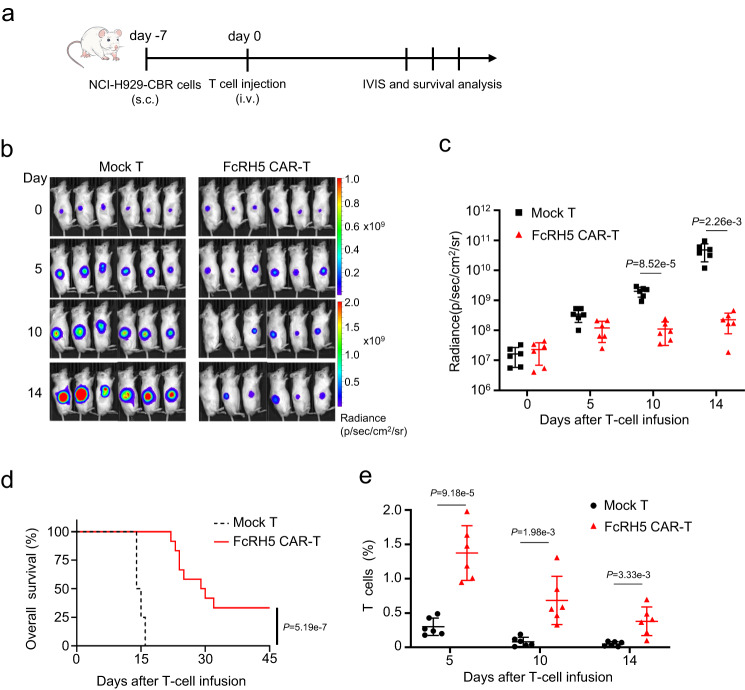
Fig. 3. FcRH5 CAR-T cells display tumoricidal activity in the subcutaneous NCI-H929-CBR xenograft model.
a Experimental schematic: Male NOG mice aged 6–8 weeks were subcutaneously inoculated with 5 × 10⁶ NCI-H929-CBR cells expressing click beetle red (CBR) luciferase on day −7, and were then intravenously infused with 5 × 10⁶ mock T or FcRH5 CAR-T cells from two different donors (n = 6 mice per group for each donor) when the tumors became palpable (day 0). b Representative tumor bioluminescence of NOG mice at different time points. c Graph showed the quantification of whole-body luminescence in NOG mice from each group at different time points with the lines connecting the mean values. Data shown are representative for results obtained in independent experiments with T-cell from 2 donors. Mean ± SD, n = 6 mice, unpaired two-tailed Student t test, d Kaplan–Meier curve for the overall survival of mice from different treatment group (n = 12 mice per group). Log-rank (Mantel-Cox) test. e The percentage of T cells (gated on human CD45+CD3+) in peripheral blood of NOG mice at different time points was determined by flow cytometric analysis. Data are representative of two independent experiments with T-cell from 2 donors (n = 12 mice per group in total). Mean ± SD, unpaired two-tailed Student t test,.

