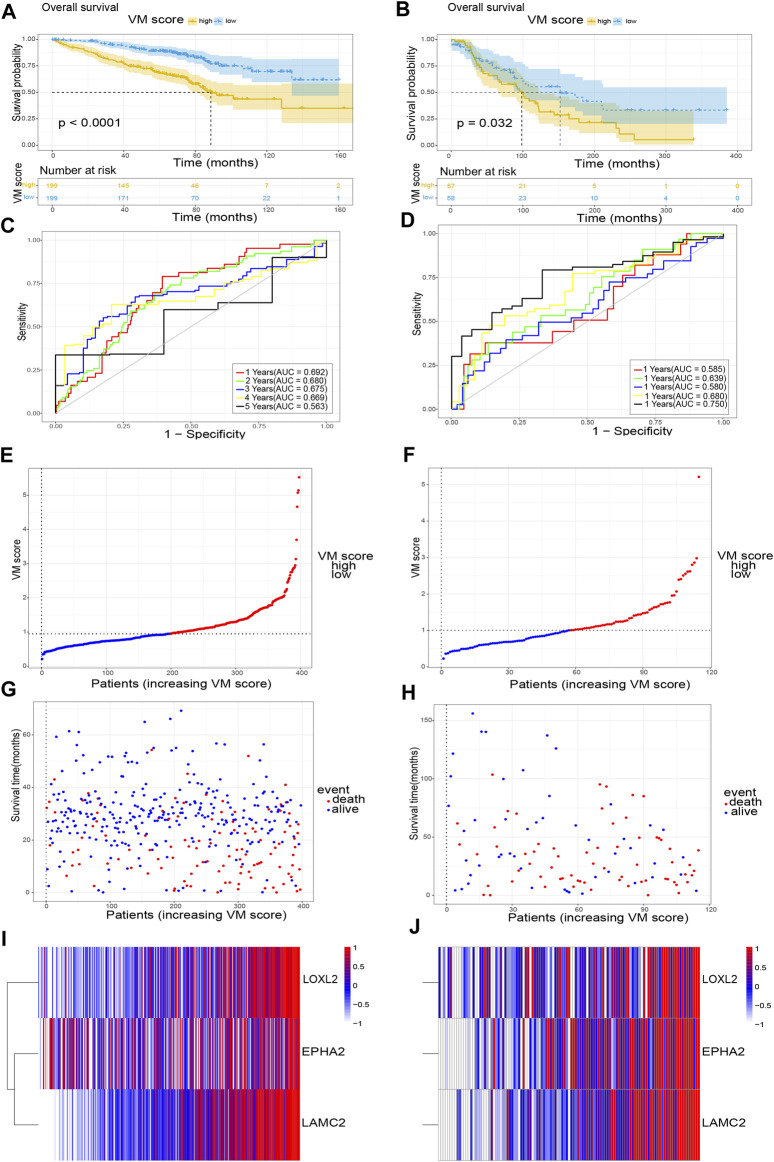
FIGURE 4.
Validation of VM score. (A), (C), (E), (G) and (I) The validation of VM score in GSE72094; (B), (D), (F), (H) and (J) The validation of VM score in GSE36471. (A), (B) KM analysis of OS. (C), (D) Time-dependent ROC curve of VM score. (E), (F) VM score distribution, (G), (H) survival status of patients, and (I), (J) heatmap of VM-related genes distribution. VM: vasculogenic mimicry. KM: Kaplan-Meier. ROC: Receiver operating characteristic.

