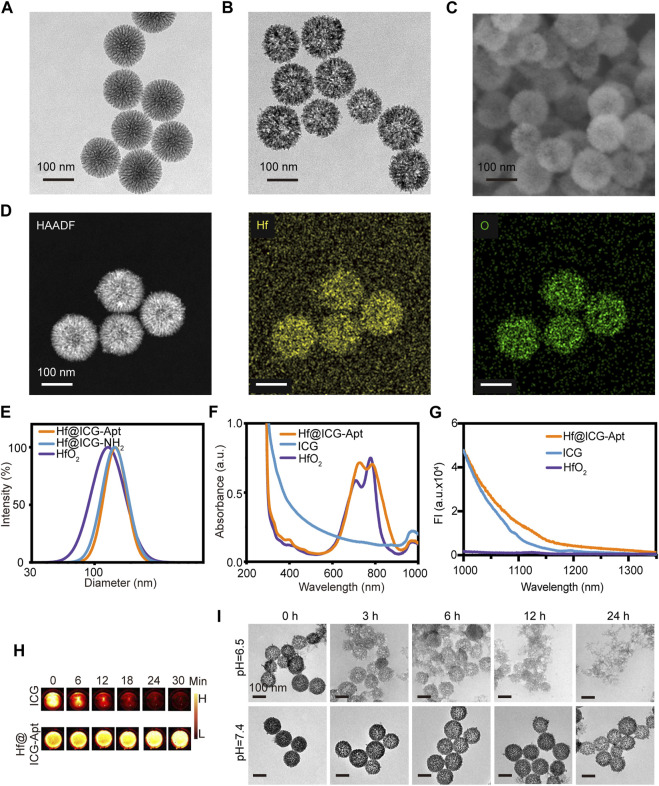
FIGURE 1.
Characterization of nanoprobes. TEM image of MSN (A) and Hf@ICG-Apt (B). (C) SEM image of Hf@ICG-Apt. (D) HAADF and elemental Hf/O mapping images of Hf@ICG-Apt. (E) Diameters of HfO2, Hf@ICG-NH2, and Hf@ICG-Apt. (F) UV-vis absorption spectra of HfO2, ICG, and Hf@ICG-Apt. (G) NIR-II emission spectra of HfO2, ICG, and Hf@ICG-Apt. (H) ICG and Hf@ICG-Apt NIR-II fluorescence pictures were taken while being continuously irritated by an 808 nm laser. (I) Degradation images were observed in different time points by TEM when Hf@ICG-Apt dispersed in water solutions with pH 7.4 or pH 6.5.

