Figure 5.
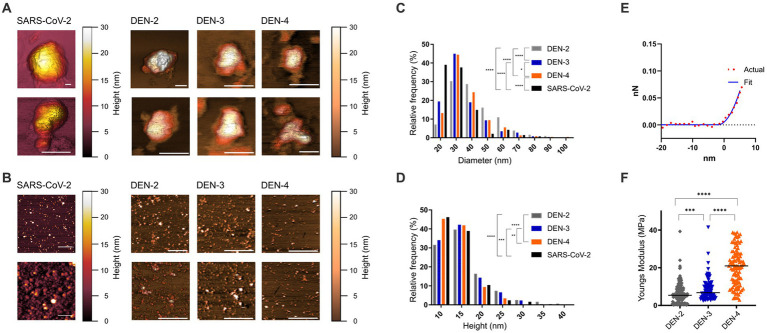
Nanoscale imaging and biophysical characterisation of SARS-CoV-2 and DEN VLPs by AFM. (A) High resolution AFM images (100–500 nm scan sizes) show ultrastructural detail of individual VLPs. White scale bars (bottom right of each image) represent 50 nm, false colour scale bar represents 30 nm Z axis (height). Scans of individual particles show particle diameter of between 50 and 300 nm. (B) AFM images at larger scan sizes (1–2 μm) show overall morphology and size of VLPs. White scale bars (bottom right of each image) represent 500 nm, false colour scale bar represents 30 nm Z axis (height). Height and diameter statistics were calculated from these and similar images. Distribution of diameter (C) and height (D) of SARS-CoV-2 and DEN VLPs for each serotype produced. (E) Representative force/distance curve collected from DEN-2 VLP showing distance as a function of force during nanoindentation of the VLP. Actual data (red circles) compared to data fitted to the Sneddon/Hertz equation (blue line), used to calculate Young’s elastic modulus. (F) Distribution of calculated Young’s elastic modulus for each of the DEN VLP serotypes. Black line indicates the mean on each scatter plot. Statistically significant differences between serotypes were determined using the Mann–Whitney test and are indicated by asterisks (p < 0.05, * < 0.05, ** < 0.005, *** < 0.0005, **** < 0.0001).

