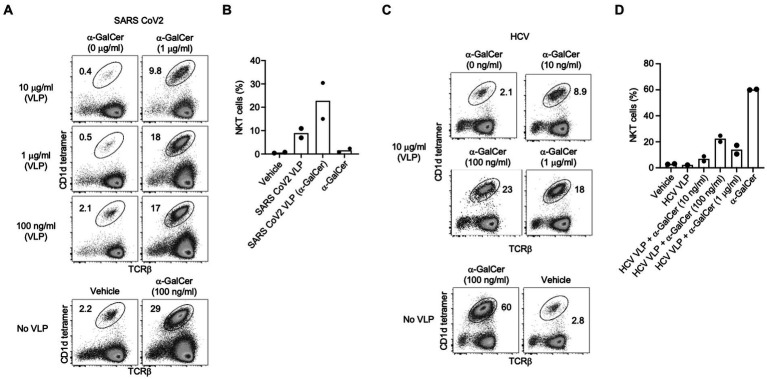
Figure 7.
NKT cell activation induced by self-adjuvanted HCV and SARS CoV-2 VLPs. Splenocytes (C57BL/6) were stimulated for 4 days in vitro. Numbers on FACS plots indicate the percentage of NKT cells amongst viable (7-AAD-), CD19- lymphocytes from (A) SARS CoV-2 or (C) HCV VLPs generated in the presence of the indicated dose of α-GalCer shown in comparison to α-GalCer alone or vehicle controls. Pooled data of NKT cells percentages following in vitro culture with (B) SARS CoV-2 or (D) HCV VLPs. Data sourced from three independent experiments.

