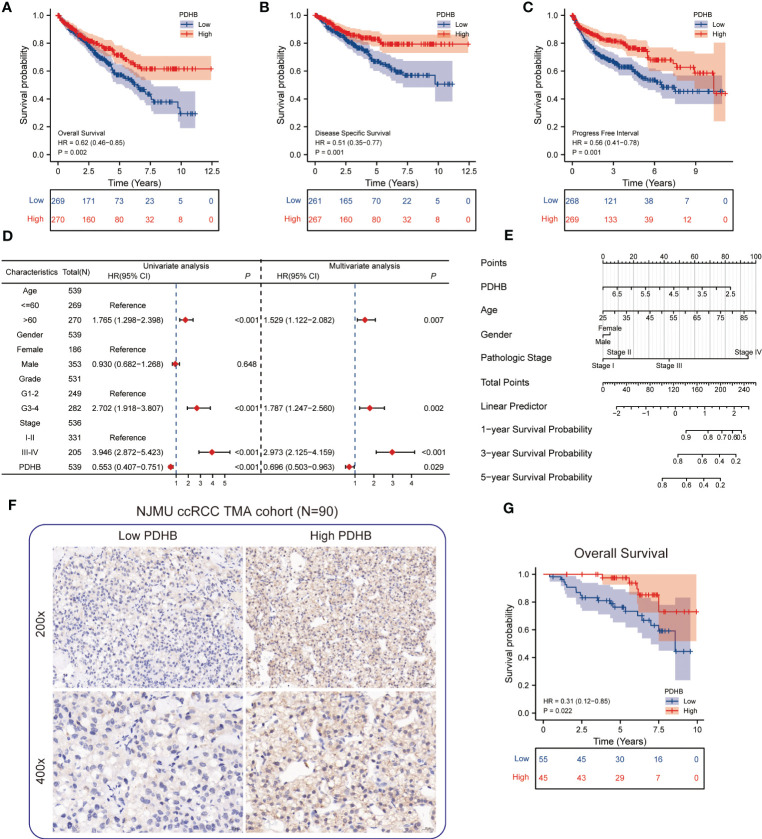
Figure 5.
Survival analysis of PDHB and construction of nomogram (A-C) Kaplan–Meier curve showed the prognostic value of HNRNPC in OS, DSS, and PFI. (D) Univariate and multivariate Cox regression analysis in overall survival (OS). (E) Construction of a nomogram for estimation of survival rates for ccRCC patients. (F) Representative images of IHC staining of low and high PDHB expression in tissue microarray (N=90). (G) Kaplan–Meier survival analysis revealed low expression of PDHB revealed unfavorable clinical outcomes among our NJMU-ccRCC cohort.

