
Figure 1.
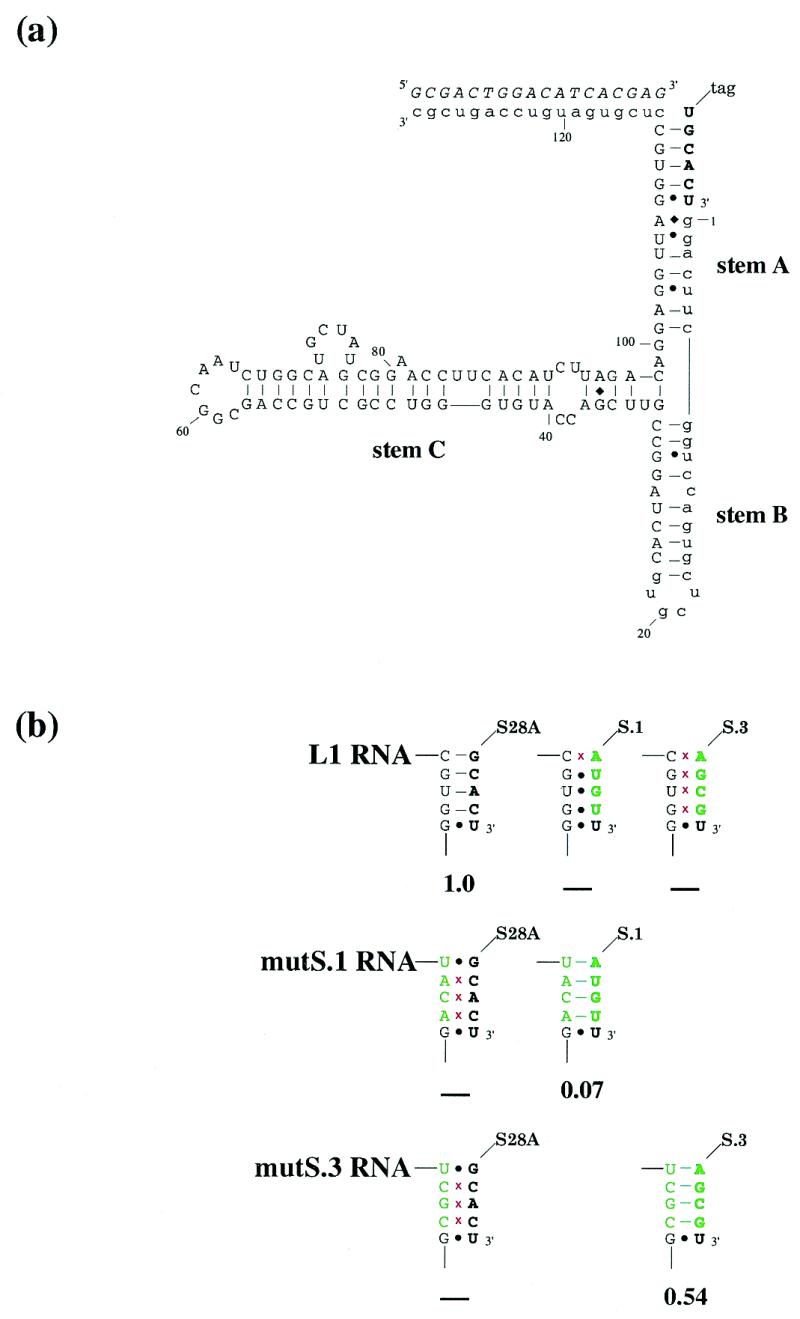
(a) Proposed secondary structure of the L1 ligase. The predicted secondary structure of the L1 ligase, based on mutational and covariation analysis. Constant regions are shown in lower case. The ligation substrate is in bold. The oligonucleotide effector is italicized. (b) Substrate binding suppression analysis. The substrate (in bold) and the region of the ribozyme involved in substrate binding are shown. Mutations relative to either the wild-type ribozyme or the wild-type substrate are shown in green; red crosses indicate disruption of Watson–Crick pairings. Ribozyme activities are shown below, relative to wild type. ‘–’ indicates no detectable activity.