Figure 4.

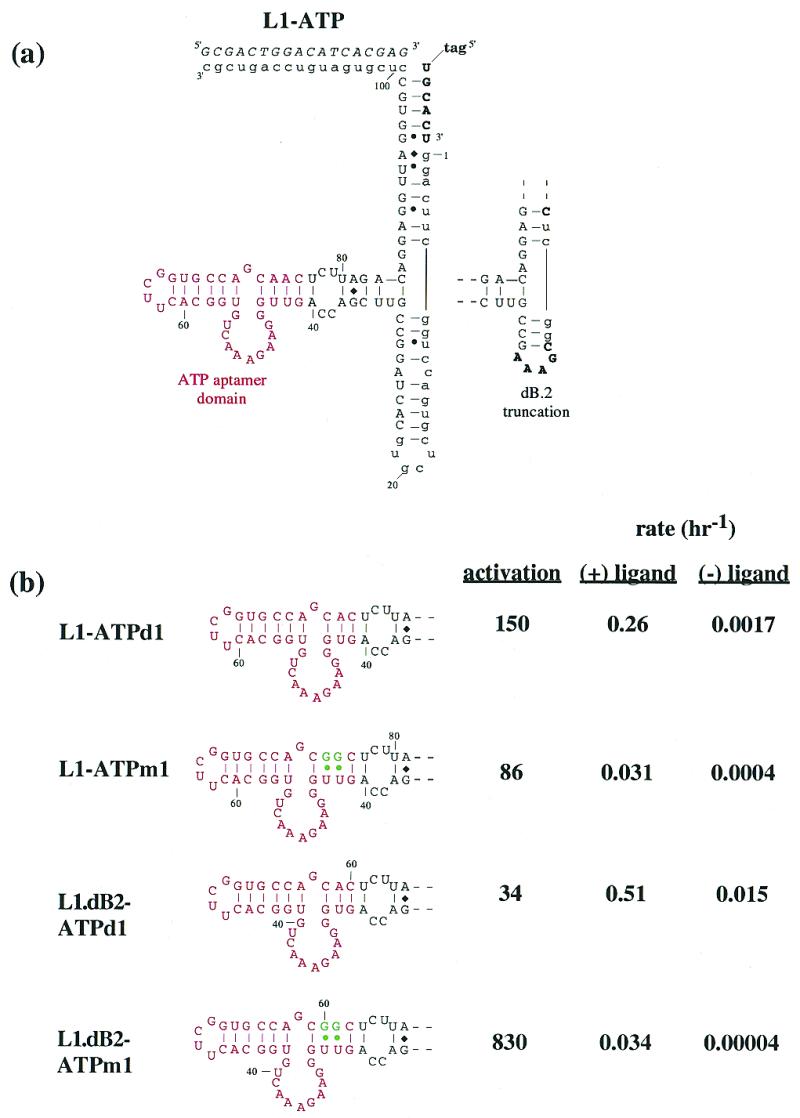
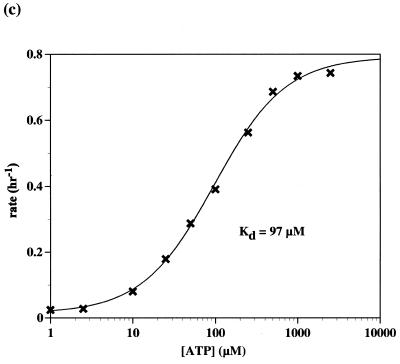
(a) Adenosine-sensing aptazyme structure. The general description of the L1 ligase aptazymes is as in Figure 1a. The anti-adenosine aptamer domain is shown in red. Mutations that are predicted to destabilize the joining region between the aptamer and the ribozyme are shown in green. (b) Aptazyme activities. Stem C variants are shown, again with the anti-adenosine aptamer in red. Aptazymes that have a ‘dB2’ designation in their title also contain the alternate Stem B shown in (a). The rate constants and relative activation in the presence of ligand (1 mM) under standard assay conditions (at pH 7.4) are shown to the right of the constructs. (c) Activity as a function of ATP concentration. Standard assays (at pH 7.7) were carried out with L1–ATPd1 [see (b)].

