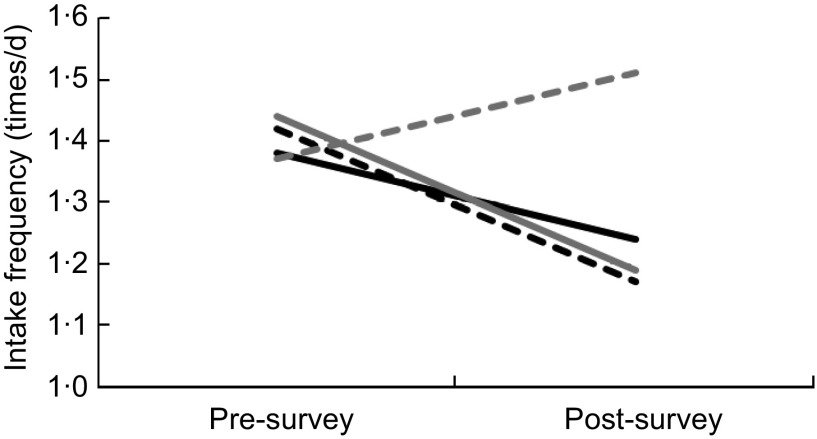
Fig. 2.
Average daily intakes of fruit reported at pre- and post-survey by study group and gender ( , intervention boys;
  , intervention girls;
  , control boys;
  , control girls); values indicate food intake frequency per day. Evaluation of the ‘Shaping Up My Choices’ programme among third-grade children, California, USA, 2010–2011 school year

