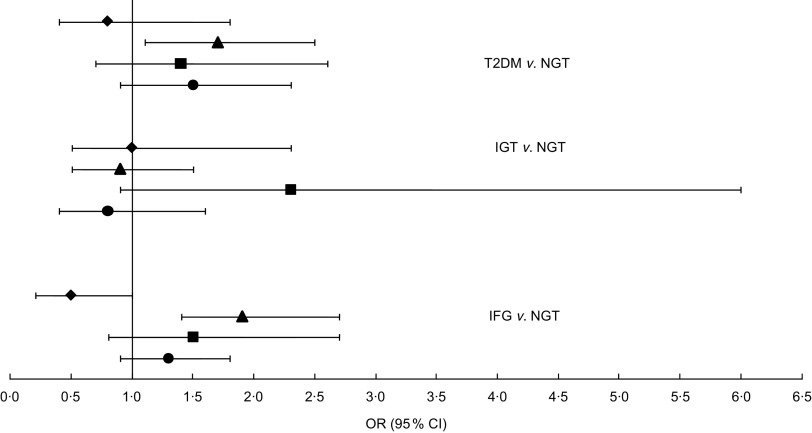
Fig. 2.
Odds ratios (with 95 % confidence intervals represented by horizontal lines) for type 2 diabetes mellitus (T2DM), impaired glucose tolerance (IGT) and impaired fasting glucose (IFG), according to dietary pattern (⧫, imported meat; ▴, traditional food; ▪, balanced diet; ●, unhealthy diet), among 2374 Inuit aged 18+ years, Greenland, 2005–2010. The standard diet was set as reference (OR = 1·0); NGT, normal glucose tolerance. Analyses were adjusted for age, sex, waist circumference, ethnicity, physical activity, smoking and total energy intake. Number of participants included in each analysis: T2DM, n 1806; IGT, n 1703; IFG, n 1901; NGT, n 1581

