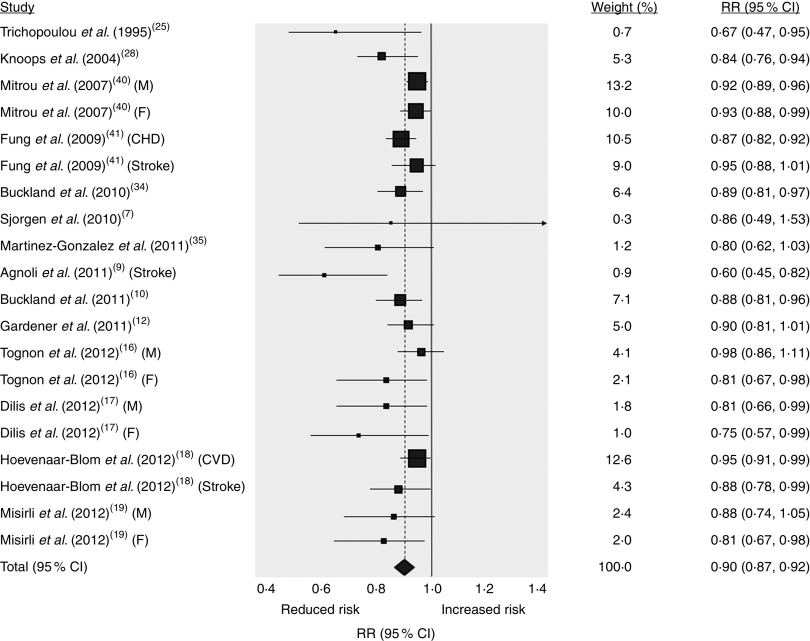
Fig. 2.
Forest plot for updated meta-analysis on greater adherence score to the Mediterranean diet (2-point increase) and cardiovascular incidence and/or mortality risk. Plotted are the relative risk (RR; represented by ▪, with the symbol size proportional to the weight in meta-analysis) and the 95 % confidence interval (represented by horizontal bars), with the summary measure (represented by - - - - - and ⧫, with the associated 95 % confidence interval indicated by the symbol width) and the line of no effect (——)

