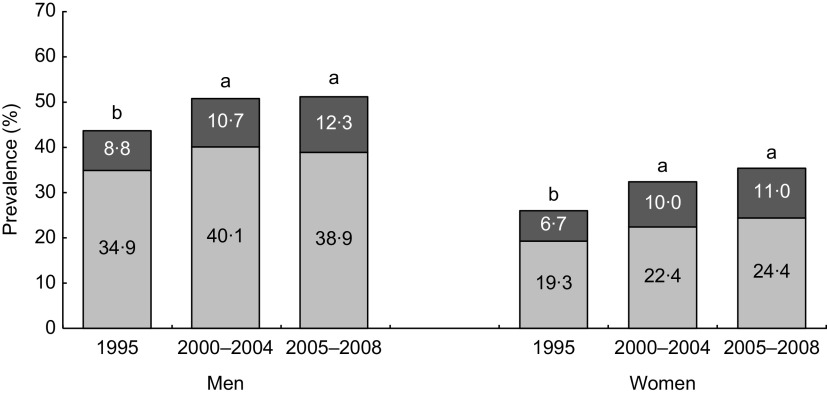
Fig. 1.
Trends in prevalence of overweight (BMI = 25·0–29·9 kg/m2;  ) and obesity (BMI ≥ 30·0 kg/m2;
  ) in Danish men and women from 1995 to 2005–2008; data from the Danish National Survey of Diet and Physical Activity (DANSDA). a,bPrevalence estimates of overweight (BMI ≥ 25·0 kg/m2) with unlike superscript letters were significantly different between survey periods for men (P < 0·05) and for women (P < 0·05), separately

