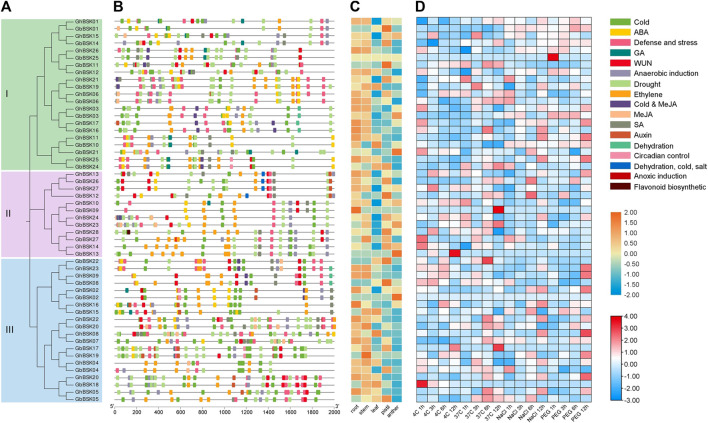
FIGURE 6.
Cis-acting elements and expression pattern analysis. (A) Evolutionary relationship of GhBSK and GbBSK. (B) Prediction of cis-acting elements of GhBSK and GbBSK. (C) Expression pattern of GhBSK and GbBSK in different tissues. (D) Expression pattern of GhBSK and GbBSK under cold, heat, salt, and PEG. The values used for drawing the heat map were normalized FPKM.

