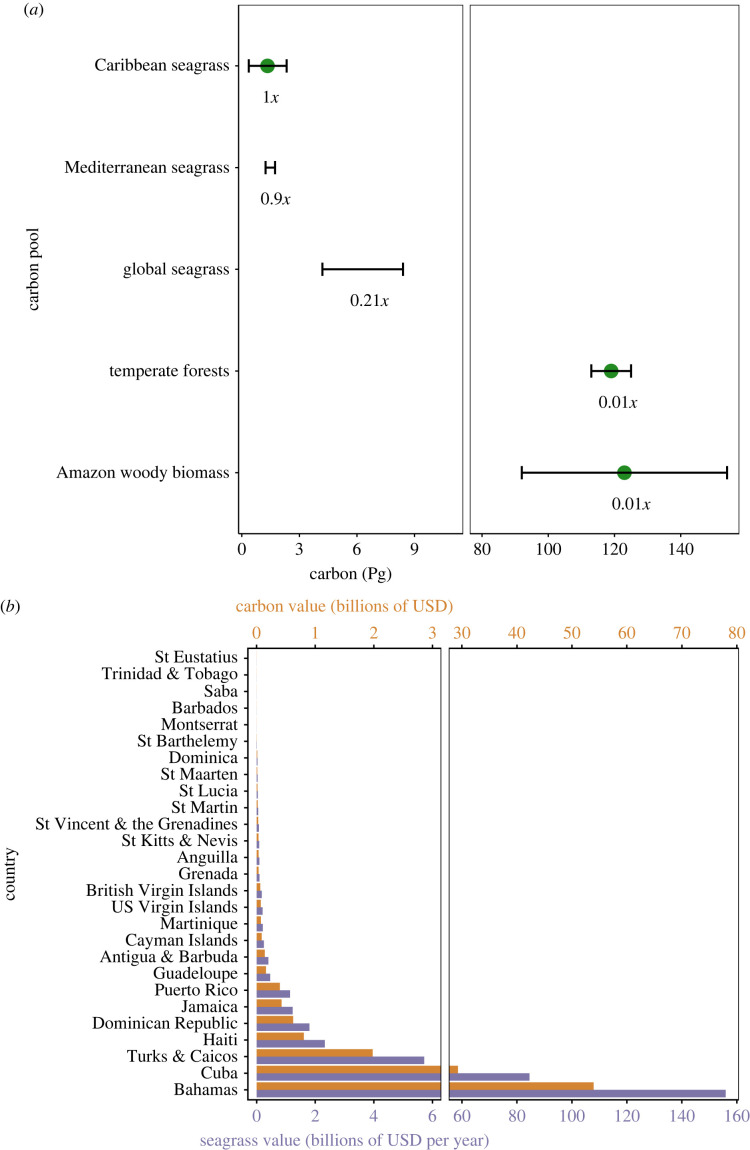
Figure 2.
(a) Carbon storage in various global pools for comparison with Caribbean seagrass beds. Error bars represent: range limits for Caribbean seagrass beds, range for Mediterranean seagrass beds [30] and global seagrass beds [31], 95% confidence interval for temperate forests [32], and 25% uncertainty for Amazon woody biomass [33]. If present, dots represent mean value. Pg = petagrams. Text values below bars indicate amount of C in Caribbean seagrass relative to each global pool. (b) Monetary value of seagrass bed ecosystem services and C in the Caribbean by country. Purple bars represent value of all seagrass bed ecosystem services per year. Orange bars represent value of carbon stored in seagrass beds calculated based on market value of carbon in California (USA) cap and trade programme.

